Investigating Bias Between Popular News Sources with Unsupervised
Topic Modeling and Sentiment Analysis.
All analyses done using Python.
Background
|
The media plays a vital role in society, keeping people informed and educated. What
the media covers provides citizens knowledge of current and important events. What
the media covers, however, can also lead to a disproportionate idea of how frequent
or significant an event may be, also referred to as the availability heuristic.
Recently, there has been a large emphasis on 'doom scrolling', or
spending considerable amounts of time focusing on negative news. This is not without
consequences, as research has started to show how news can not only shape our political
believes, such as attides towards immigrants and
other countries
but can potentially itself influence the health of the
economy
as well as the mental and physical health of the consumer.
| 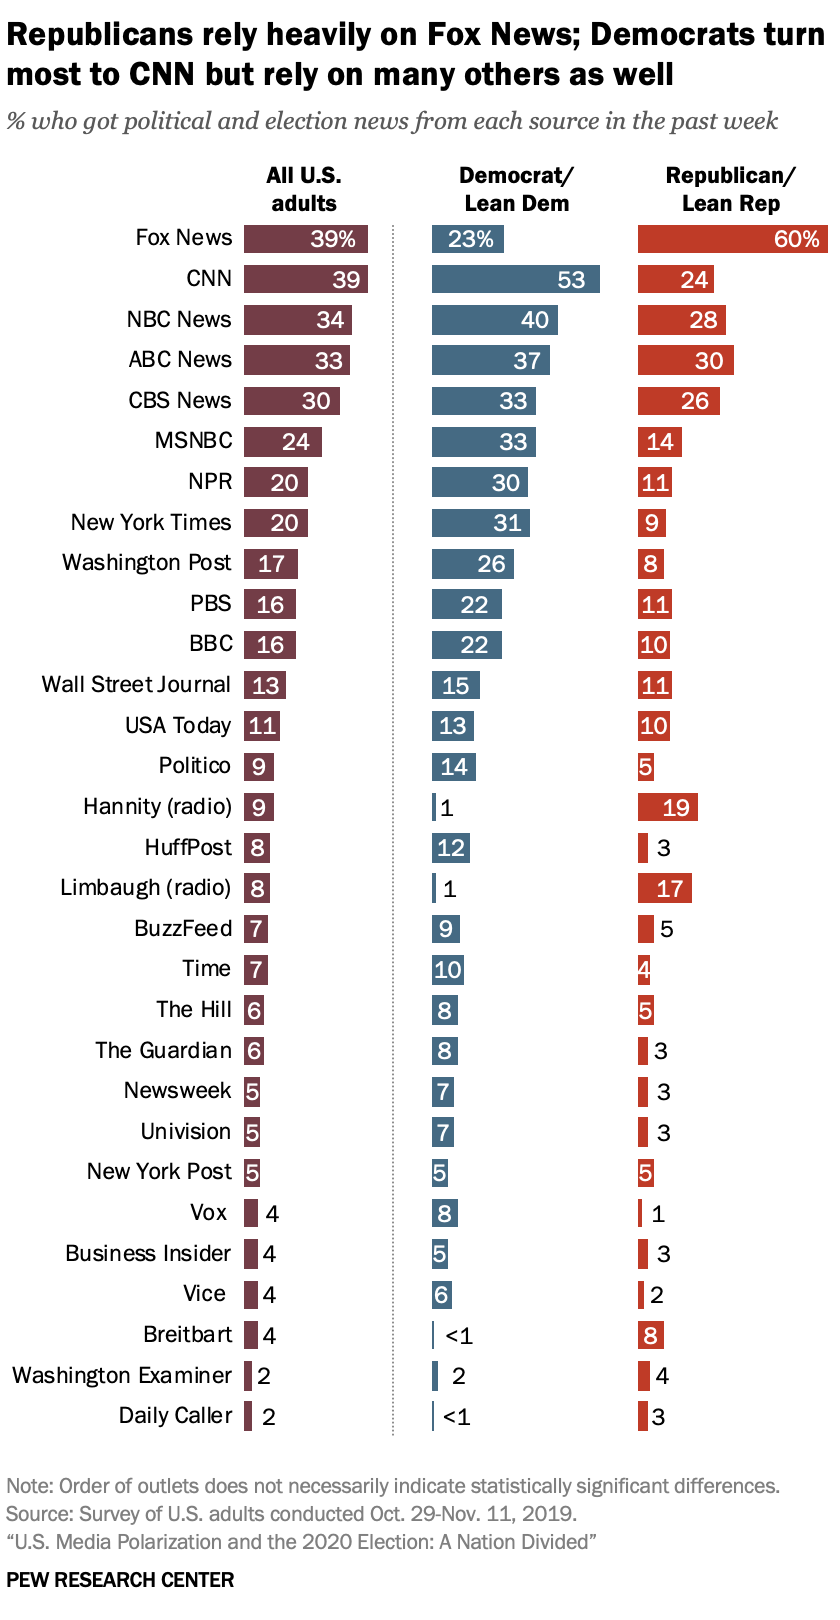 Image Source |
Data Collection
News Articles
The dataset used for this project is the NELA-GT-2020 datasets from the Harvard Dataverse.
For my investigation, I filtered the data to include only articles published by
six popular news sources in the United States: CBS, CNN, Fox News, The New York Times, USA Today,
and the Washington Post. Due to the size of the dataset I randomly selected 3,000 articles from each news source.
Below is a snapshot of the data prior to any text preprocessing.
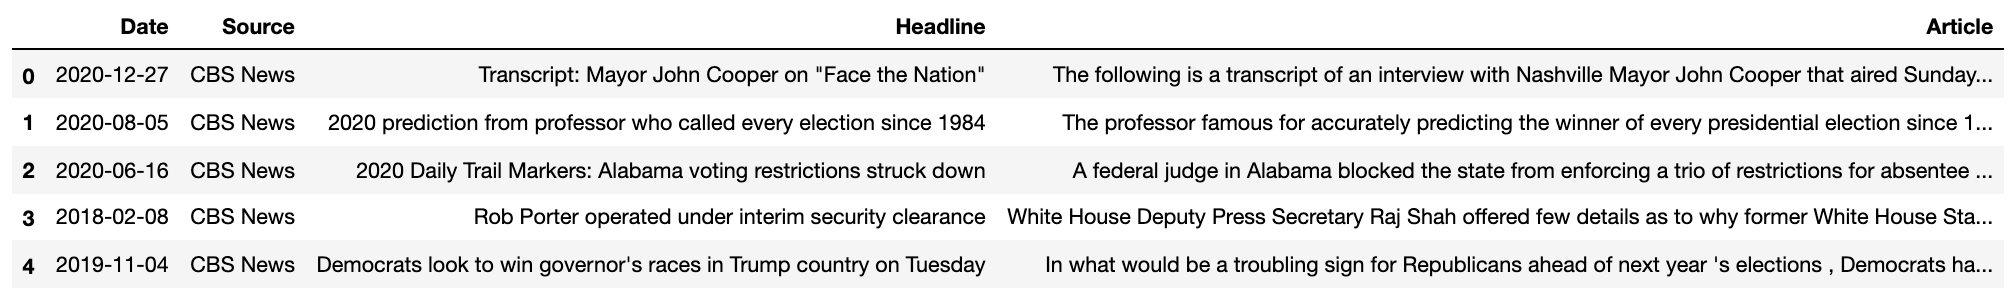
Also, at this time I've decided to only analyze news headlines. Analyzing the article contents will
be something I'll continue to explore, however due to the length of the text data, labeling an article's sentiment is
difficult as there are often many different sentiments expressed throughout an article, as well as the potential for
multiple topics to be discussed. Thus for simplicity I've presented only results from the analysis of headlines.
Data Preparation
Text Preprocessing
The functions used to preprocess the text are available NLTK library.
To prepare the data, I performed standard text preprocessing steps prior to
passing the data into my models. This included stop word removal, contraction
expansion, converting to lowercase, and subsequently word tokenization. After
tokenization, bigrams and trigrams were created to account for potential common phrases
that may occur together. Finally word lemmatization was performed on the tokenized text.
The Gensim package was then used to create a dictionary of tokens. The dictionary was
subsequently filtered to exclude any tokens that appeared in less than 15 headlines and
more than 50% of the headlines, suggesting they may not be beneficial to separate topics.
Following the text preprocessing, I created two different corpus objects to pass into my
topic models. These were represented by the commonly used Bag of Words and Term Frequency
- Inverse Document Frequency matrices.
Topic Modeling
Latent Dirichlet Allocation (LDA)
LDA is an unsupervised topic modeling algorithm. It assumes text data is a mixture of topics
which themselves have probabilities corresponding to specific words. Thus the representation of each
topic is a combination of words, instead of a single word. The LDA algorithm evaluates the words
in each document and labels each document as a combination of topics, in which the sum of the topics contribution
sum to one. The document can then be assigned to the topic which composes the majority of the document.
I've read conflicting opinions on whether or not using the TF-IDF corpus as input into LDA models is appropriate,
however I have used the topic modeling output from the Bag of Words dictionary regardless.
Latent Semantic Indexing (LSI)
LSI is another unsupervised topic modeling algorithm to learn hidden topics in text.
It reduces the dimensionality of the corpus matrix via Singular Value Decomposition into a 'k' dimensional
matrix, where k is the number of topics for the document set. The rows of this matrix represents document
vectors with each column (topic) coordinate representing the role that topic plays in that document.
Similar documents (in terms of topics) are thus nearer to each other within the k-dimensional space.
The output of the LSI algorithm is different than the LDA models, in that it does not provide dominant
topics for each document. It provides an overall set of topics that encompass the document set and groups
similar documents together in space.
Topic Modeling Results
Parameter Selection
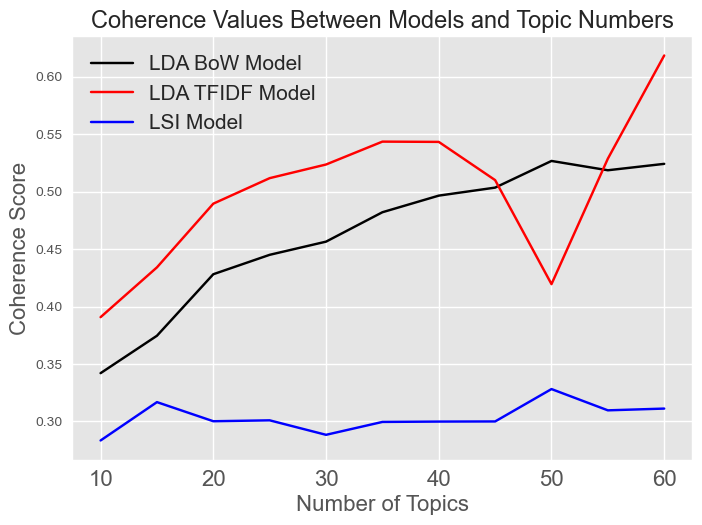
For each model I used the coherence score for each topic number to evaluate
the model performance. In general, the higher the coherence the better the model.
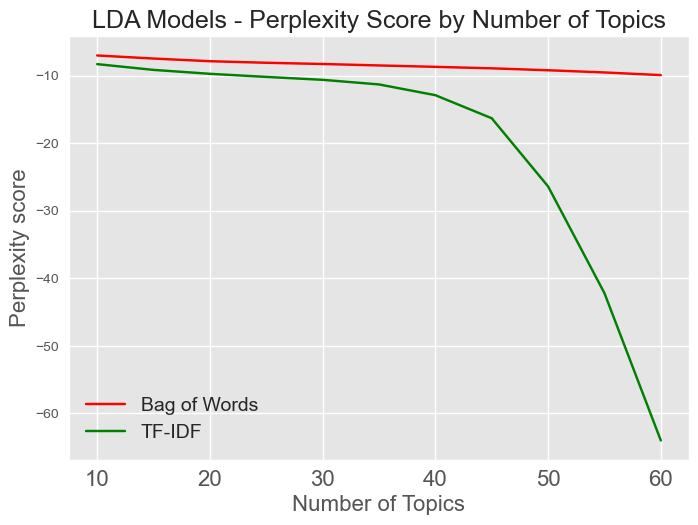
Additionally, the LDA models can be evaluated with the
perplexity measure which I further evaluated. Perplexity, on the other hand, is
smaller in better performing models.
|
 |
Because these models are unsupervised, however, its important to visually inspect the created models by each algorithm. After doing this, I decided to select 35 topics for LDA Bag of Words model, 60 topics for the LDA TF-IDF model, and 50 topics for the LSI model.
Topics
Each model produced the number of specified topics. As mentioned above, the
LDA models assign each document to a specific topic, whereas the LSI model provides
a set of topics for the entire document set. Below are snapshots of the topics
output from each model. Below these snapshots is an interactive visualization of the LDA TF-IDF
topic model using the Pyldavis package from the Gensim Library. It uses principal
component analysis to reduce the feature space and plot the topics onto 2-D space. This
visualization indicates how well the topics separate. The goal is to minimize the overlap
between different topics. There is some overlap within my visualization, however for this
project I felt comfortable continuing with the model.
Most Frequent Topics from the LDA Bag of Words Model:
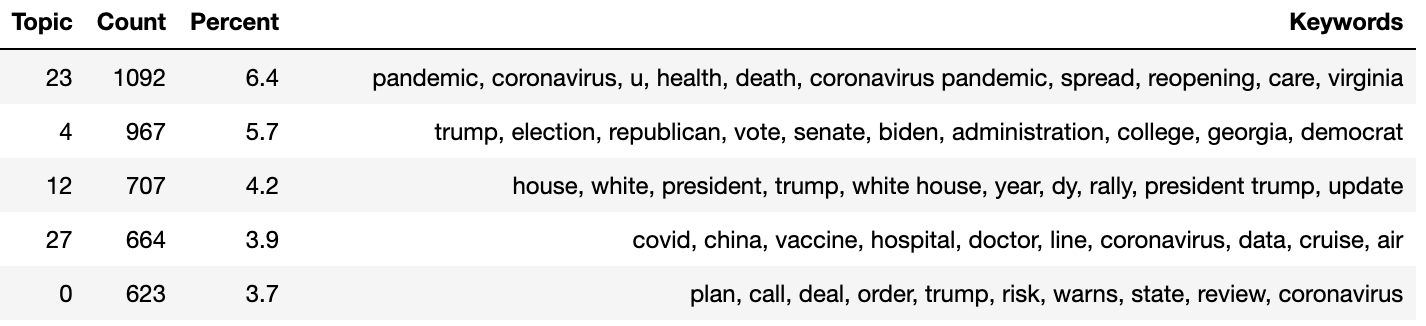
|
Most Frequent Topics from the LDA TF-IDF Model:
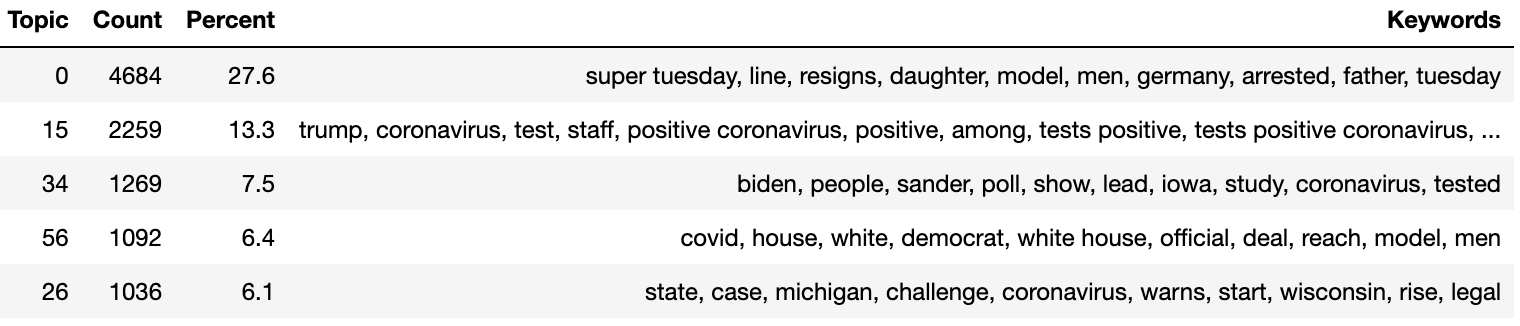
|
First Five Topics from the LSA TF-IDF Model:
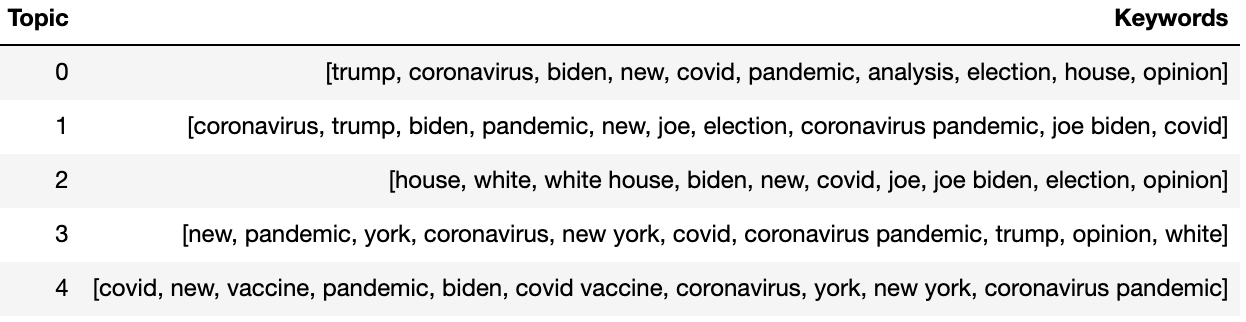
|
Visualizing the LDA Bag of Words Topic Model
Sentiment Analysis
Before performing sentiment analysis I looked through the topics output by the LDA Bag of Words topic
model and selected 5 topics that I thought may present conflicting opinions between different
news sources. I then used two sentiment analysis algorithms (VADER and TextBlob) to evaluate
the news headlines within my dataset.
Valence Aware Dictionary and sEntiment Reasoner (VADER)
VADER is a commonly used lexicon and rule-based algorithm associated with the NLTK library. It was
initially developed for analysis of social media posts, however has shown to perform well with
other types of text. To perform sentiment analysis, I passed in the
unprocessed headlines, and the VADER algorithm performs the preprocessing steps itself. These
preprocessing steps are comparable to the steps I performed for topic modeling above.
VADER uses a pre-defined dictionary that contains emotionally defined words with associated weights
defined by the strength or intensity of the word. Examples of positive words might 'great', 'amazing',
and 'beautiful', but also terms such as 'bad ass' are accounted for in the
dictionary and noted as positive. VADER also accounts for negation words such as
'not', which can flip the direction of the sentiment in a text.
The algorithm evaluates the combination of positive, neutral, and negatively defined terms and
outputs an overall polarity score between [-1, 1]. Scores < -.05 are indicate
a negative sentiment, whereas scores > 0.05 indicate positive sentiment. Scores within
[-0.05, 0.05] are define as neutral sentiments.
TextBlob
TextBlob is another lexicon and rule-based algorithm. It utilizes the NLTK and pattern
library to perform a wide variety of NLP tasks. For the sentiment analysis, it largely
performs the same steps as the VADER algorithm, however uses a different dictionary with the
defined terms and weights.
In addition to the ability to evaluate sentiments in given texts, TextBlob can evaluate the
objectivity of given text which I do in this project.
Sentiment Analysis Results
VADER
Below is an image of the output from the VADER algorithm. Each headline is given a label as displaying
positive, neutral, or negative sentiment.
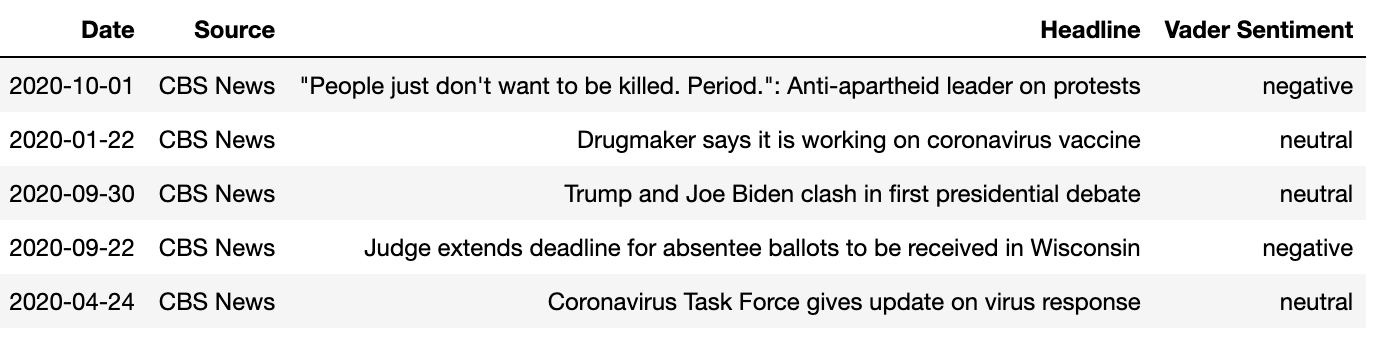
|
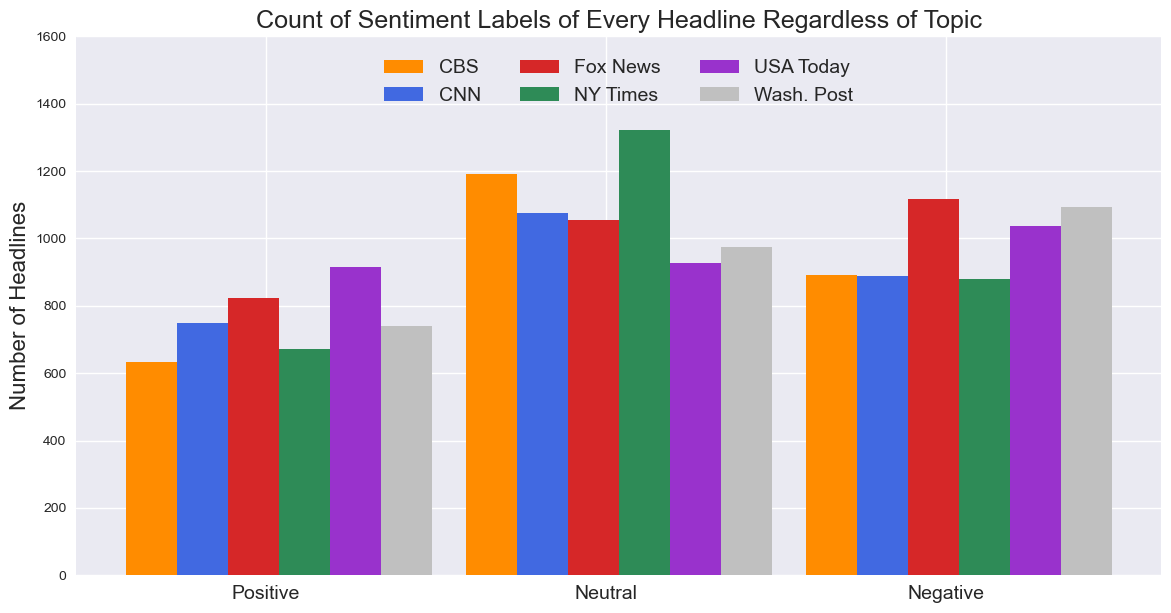
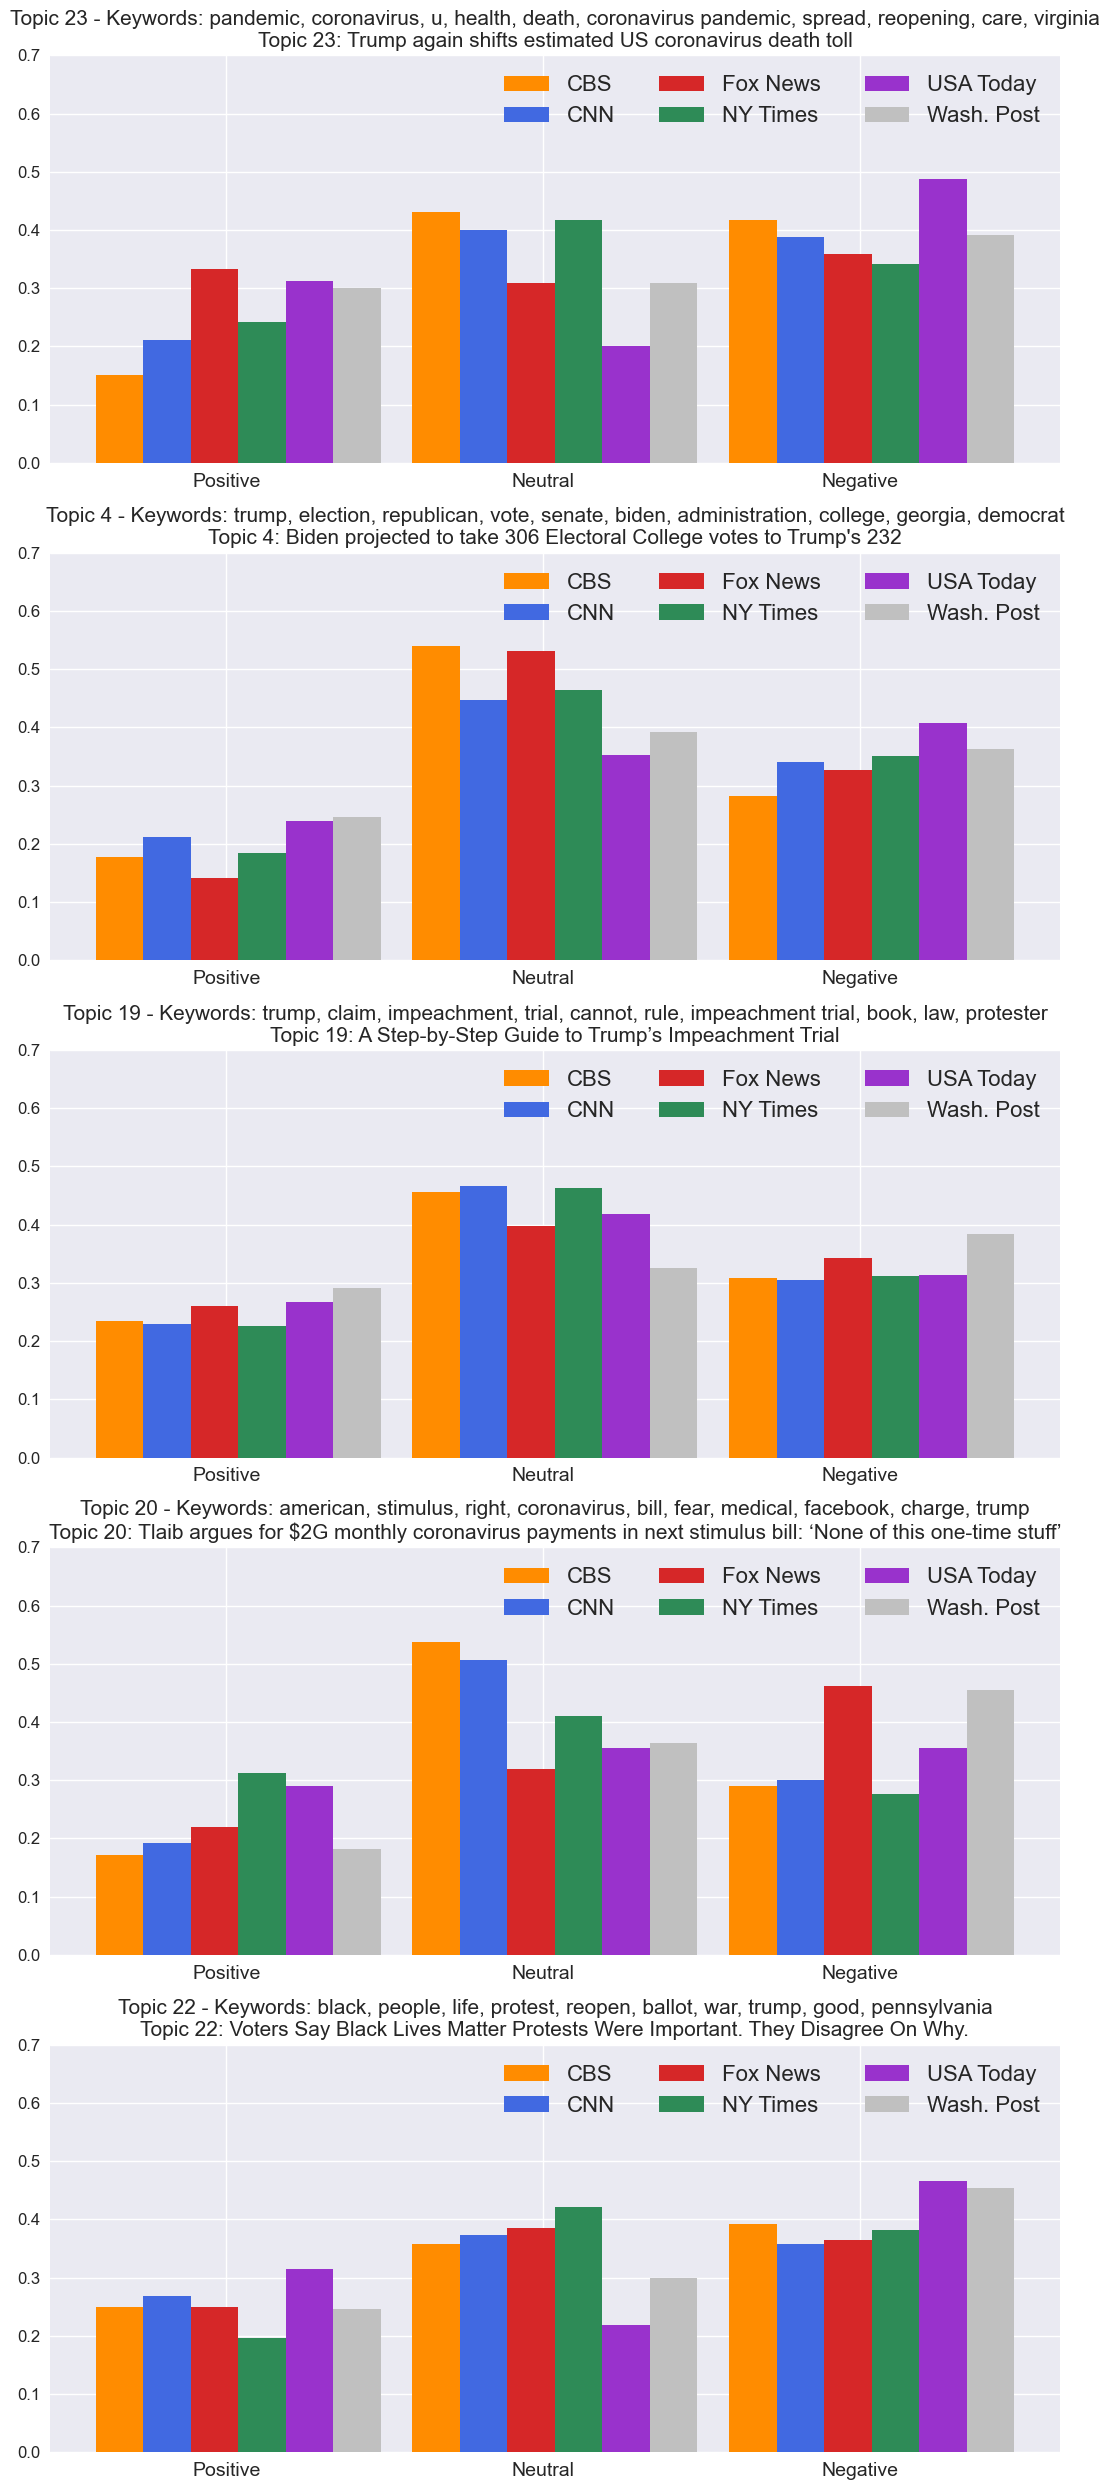
The combined output for the VADER is presented in the figures below. Displayed is the overall
sentiments of all given headlines in the data as well as the sentiments of five topics
selected from the LDA Bag of Words topic model. The title of each graph is the topic number
followed by the keywords associated with that topic. Additionally, each topic references a
single headline which is most representative of said topic. This is also includes in the title of
each graph. These graphs are also adjusted for the number of headlines published within that topic
by each source to more appropriately compare.
For the most part, it seems that the majority sentiment is actually neutral, which is somewhat
surprising to me. However this is using the predefined threshold of 0.05 to define
neutrally labeled sentiments. This threshold can be increased or decreased, resulting
in headlines being labeled as neutral more often or less often, respectively.
Overall, it does appear that USA Today provides the most frequently positive headlines, whereas
CBS and the New York Times provide the most frequently neutral headlines. Fox News and the
Washington Post, on the other hand, are most frequently negative.
Within each of the five topics, there is seem some disparity in the sentiment labels which I
find interesting. I won't discuss each topic specifically, but the figures below display each
topic and source clearly.
Sentiment Analysis Output: VADER Algorithm
|
Sentiment Analysis Output for Five Chosen Topics: VADER Algorithm
|
TextBlob
Interestingly, the sentiment analysis results were strikingly different for TextBlob than for
the VADER algorithm. TextBlob was
considerably more likely to label headlines as neutral, while almost never labeling a headline
as negative. When evaluating the source code, the only considerable difference
I could see between how the two models perform were that they each used different dictionaries and
and thus the emotional words and associated weights would be different. As my analyses are unsupervised,
its difficult to quantitatively evaluate the performance of each model, however I found VADER
algorithm to be more accurate upon personal evaluation.
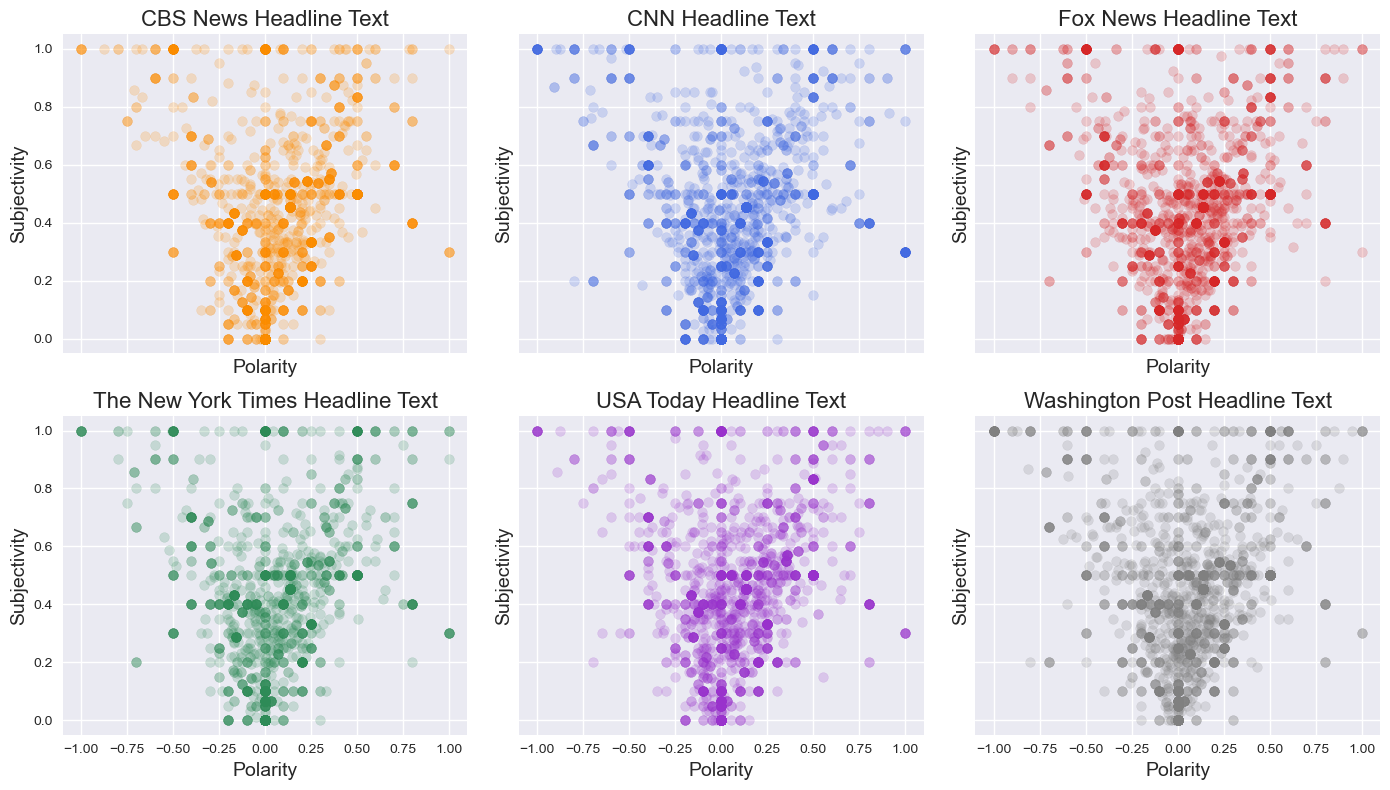
For TextBlob I've chosen to present the overall polarity (sentiment) scores as well as the
subjectivity scores. For the polarity measure, scores are between [-1, 1]. Values less than zero are defined
as having a negative sentiment, while scores greater than zero show positive sentiment. A score of zero
represents neutral. Subjectivity scores fall between [0, 1] with 0 = 'very objective' and 1 =
'very subjective'.
In the images below, its apparent that as headlines become increasingly
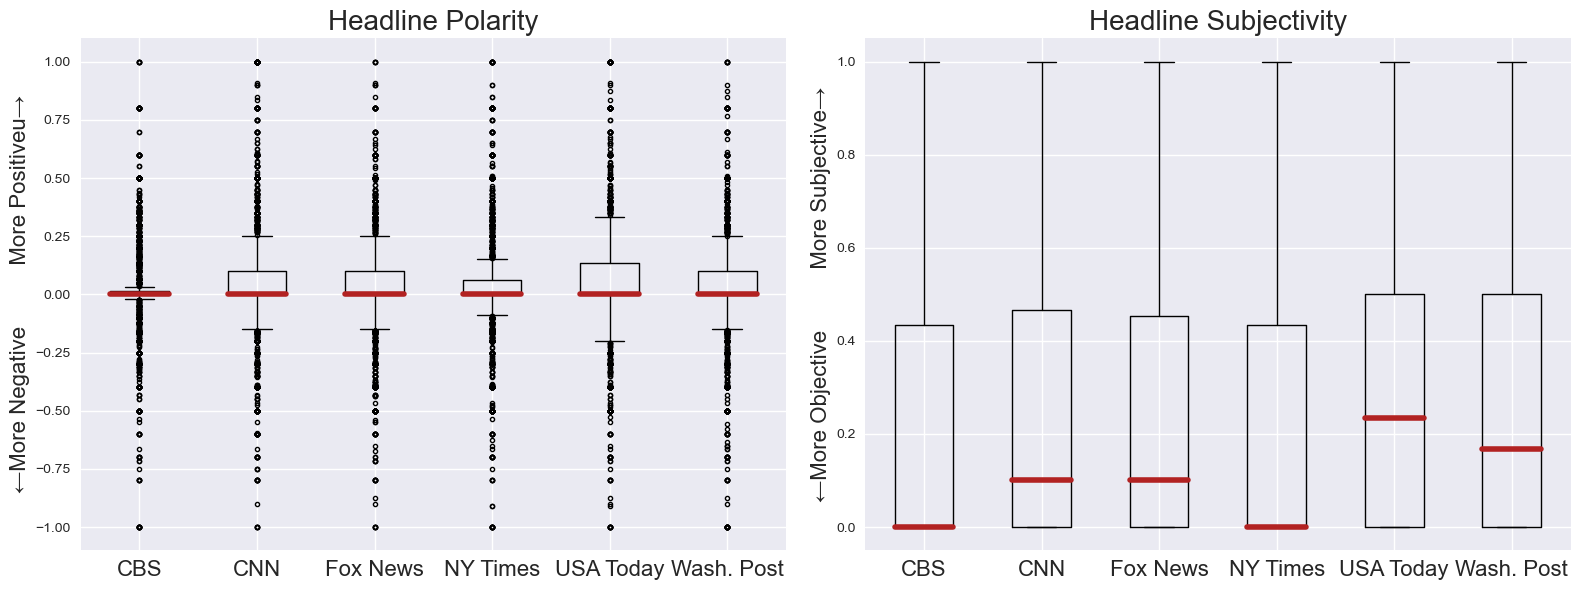
polar (emotional), they become more subjective. I've also included box plot figures below to more
accurately present the polarity and subjectivity data. The median headlines for each source is relatively
neutral in sentiment, with CBS and the New York Times displaying the tightest distribution around the
median. For subjectivity data, CBS and the New York Times show the highest level of objectivity (least
subjective) in their headlines, while USA Today and the Washington Post display more subjective headlines
(although still relatively objective).
Polarity by Subjectivity Scores for each News Source: TextBlob
|
Boxplot view of Subjectivity and Polarity Scores for News Headlines
|
Closing
Overall I felt that the results from this project were very interesting as their do seem to
be some differences between sources in their sentiments toward different topics. 2020 was a unique year
which seems to have had a few topics dominate the headlines more than other years, so it'd be interesting
to extend this analysis to earlier years.
Ideally, I'd like to continue working on this while researching different algorithms which would enable me to
more precisely measure 'doomscrolling'. One limitation of
unsupervised learning is that there are no labels that I can use to train the algorithms and improve the
sentiment classification of each headline. Further, I'd like to find methods in which I can evaluate the entirety of the
news articles more accurately, not just the headlines. It may be benficial to explore different
topic modeling algorithms such as HDP and NMF which I plan to study next. There are also many other sentiment
analysis algorithms which may be better suited for longer text input such as entire news articles.