Investigating the Impact of Environmental Variables on Violent Behavior in Bronx County, New York.


All analyses done using R programming language.

A considerable amount of research suggests that acute changes in environmental conditions (e.g. temperature, sunlight, precipitation, levels of pollution) may be associated with negative human behaviors. The mechanism of the relationship between these environmental factors and violence / impulsivity is still unknown, however it may be due to neurobiological changes caused by these factors. A small summary of research is noted below:

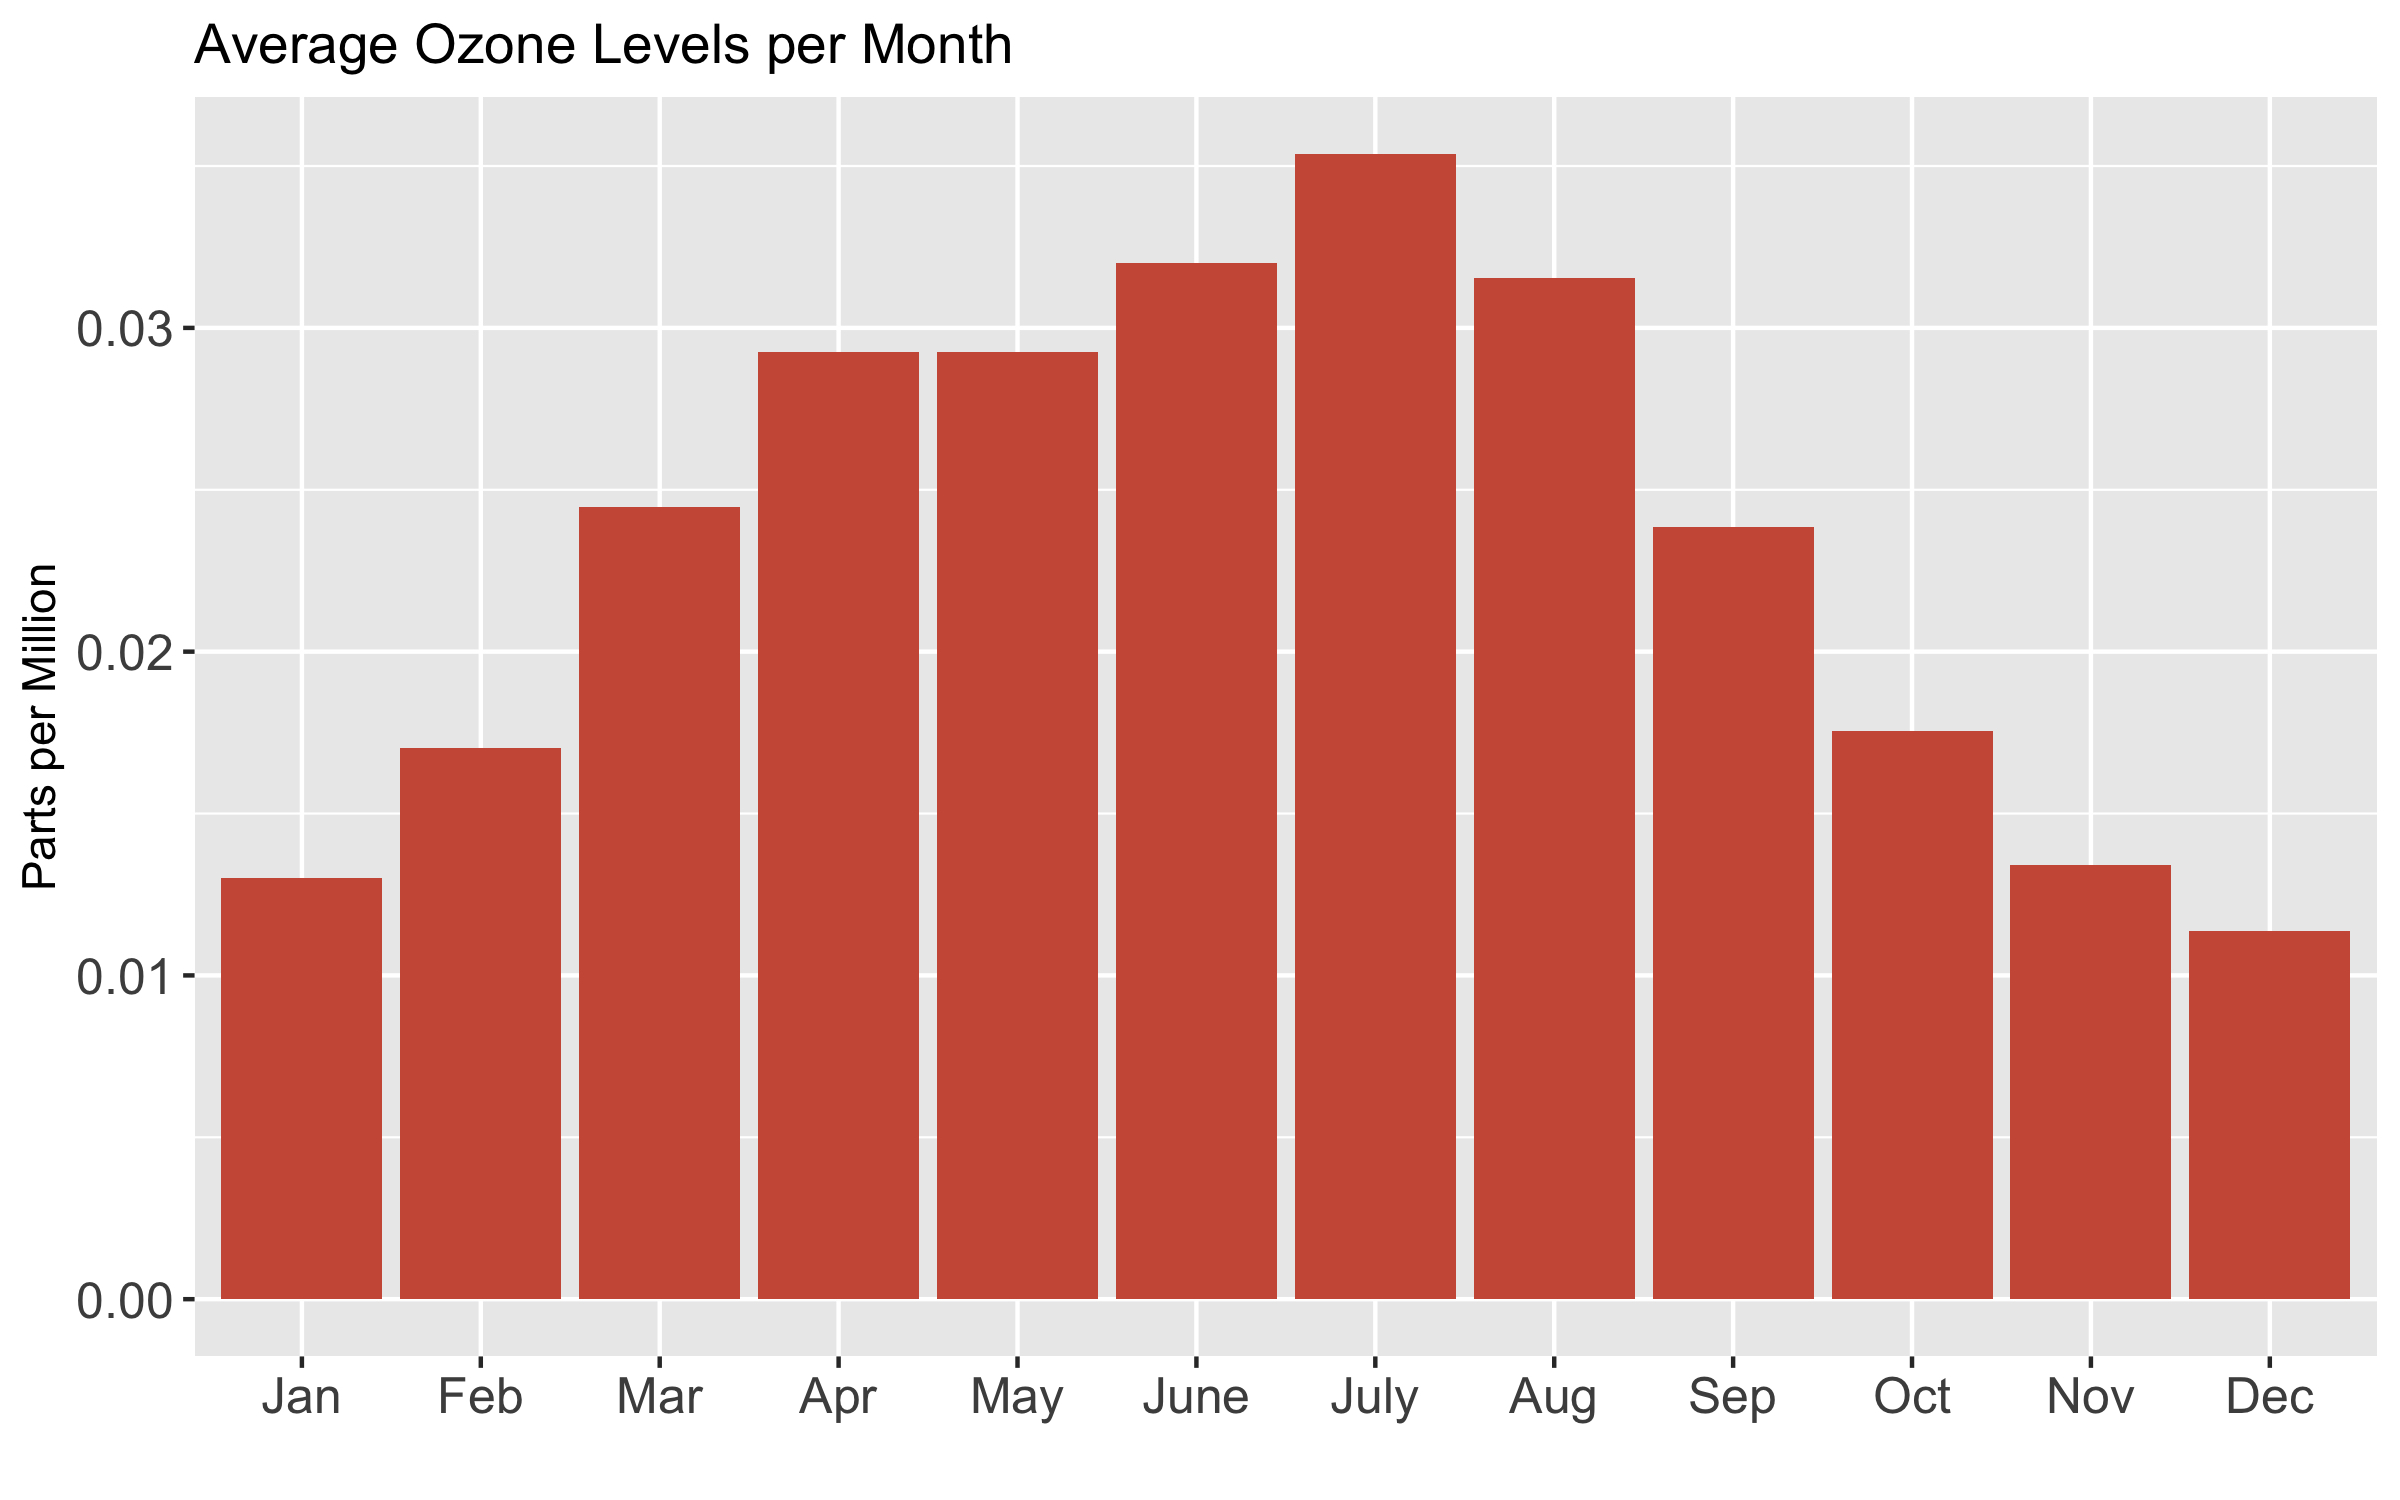
  • Controlling for temperature and weather, changes in levels of PM2.5 and ozone across the United States show significant acute effects on violent crimes, with a particular emphasis on assaults. However, the researchers found no relationship between levels of PM2.5 or ozone and non-violent property crimes. (Burkhardt et al., 2019).
  • In Southern California, long term increased exposure to PM2.5 is associated with increased adolescent delinquent behavior (Younan et al., 2018).
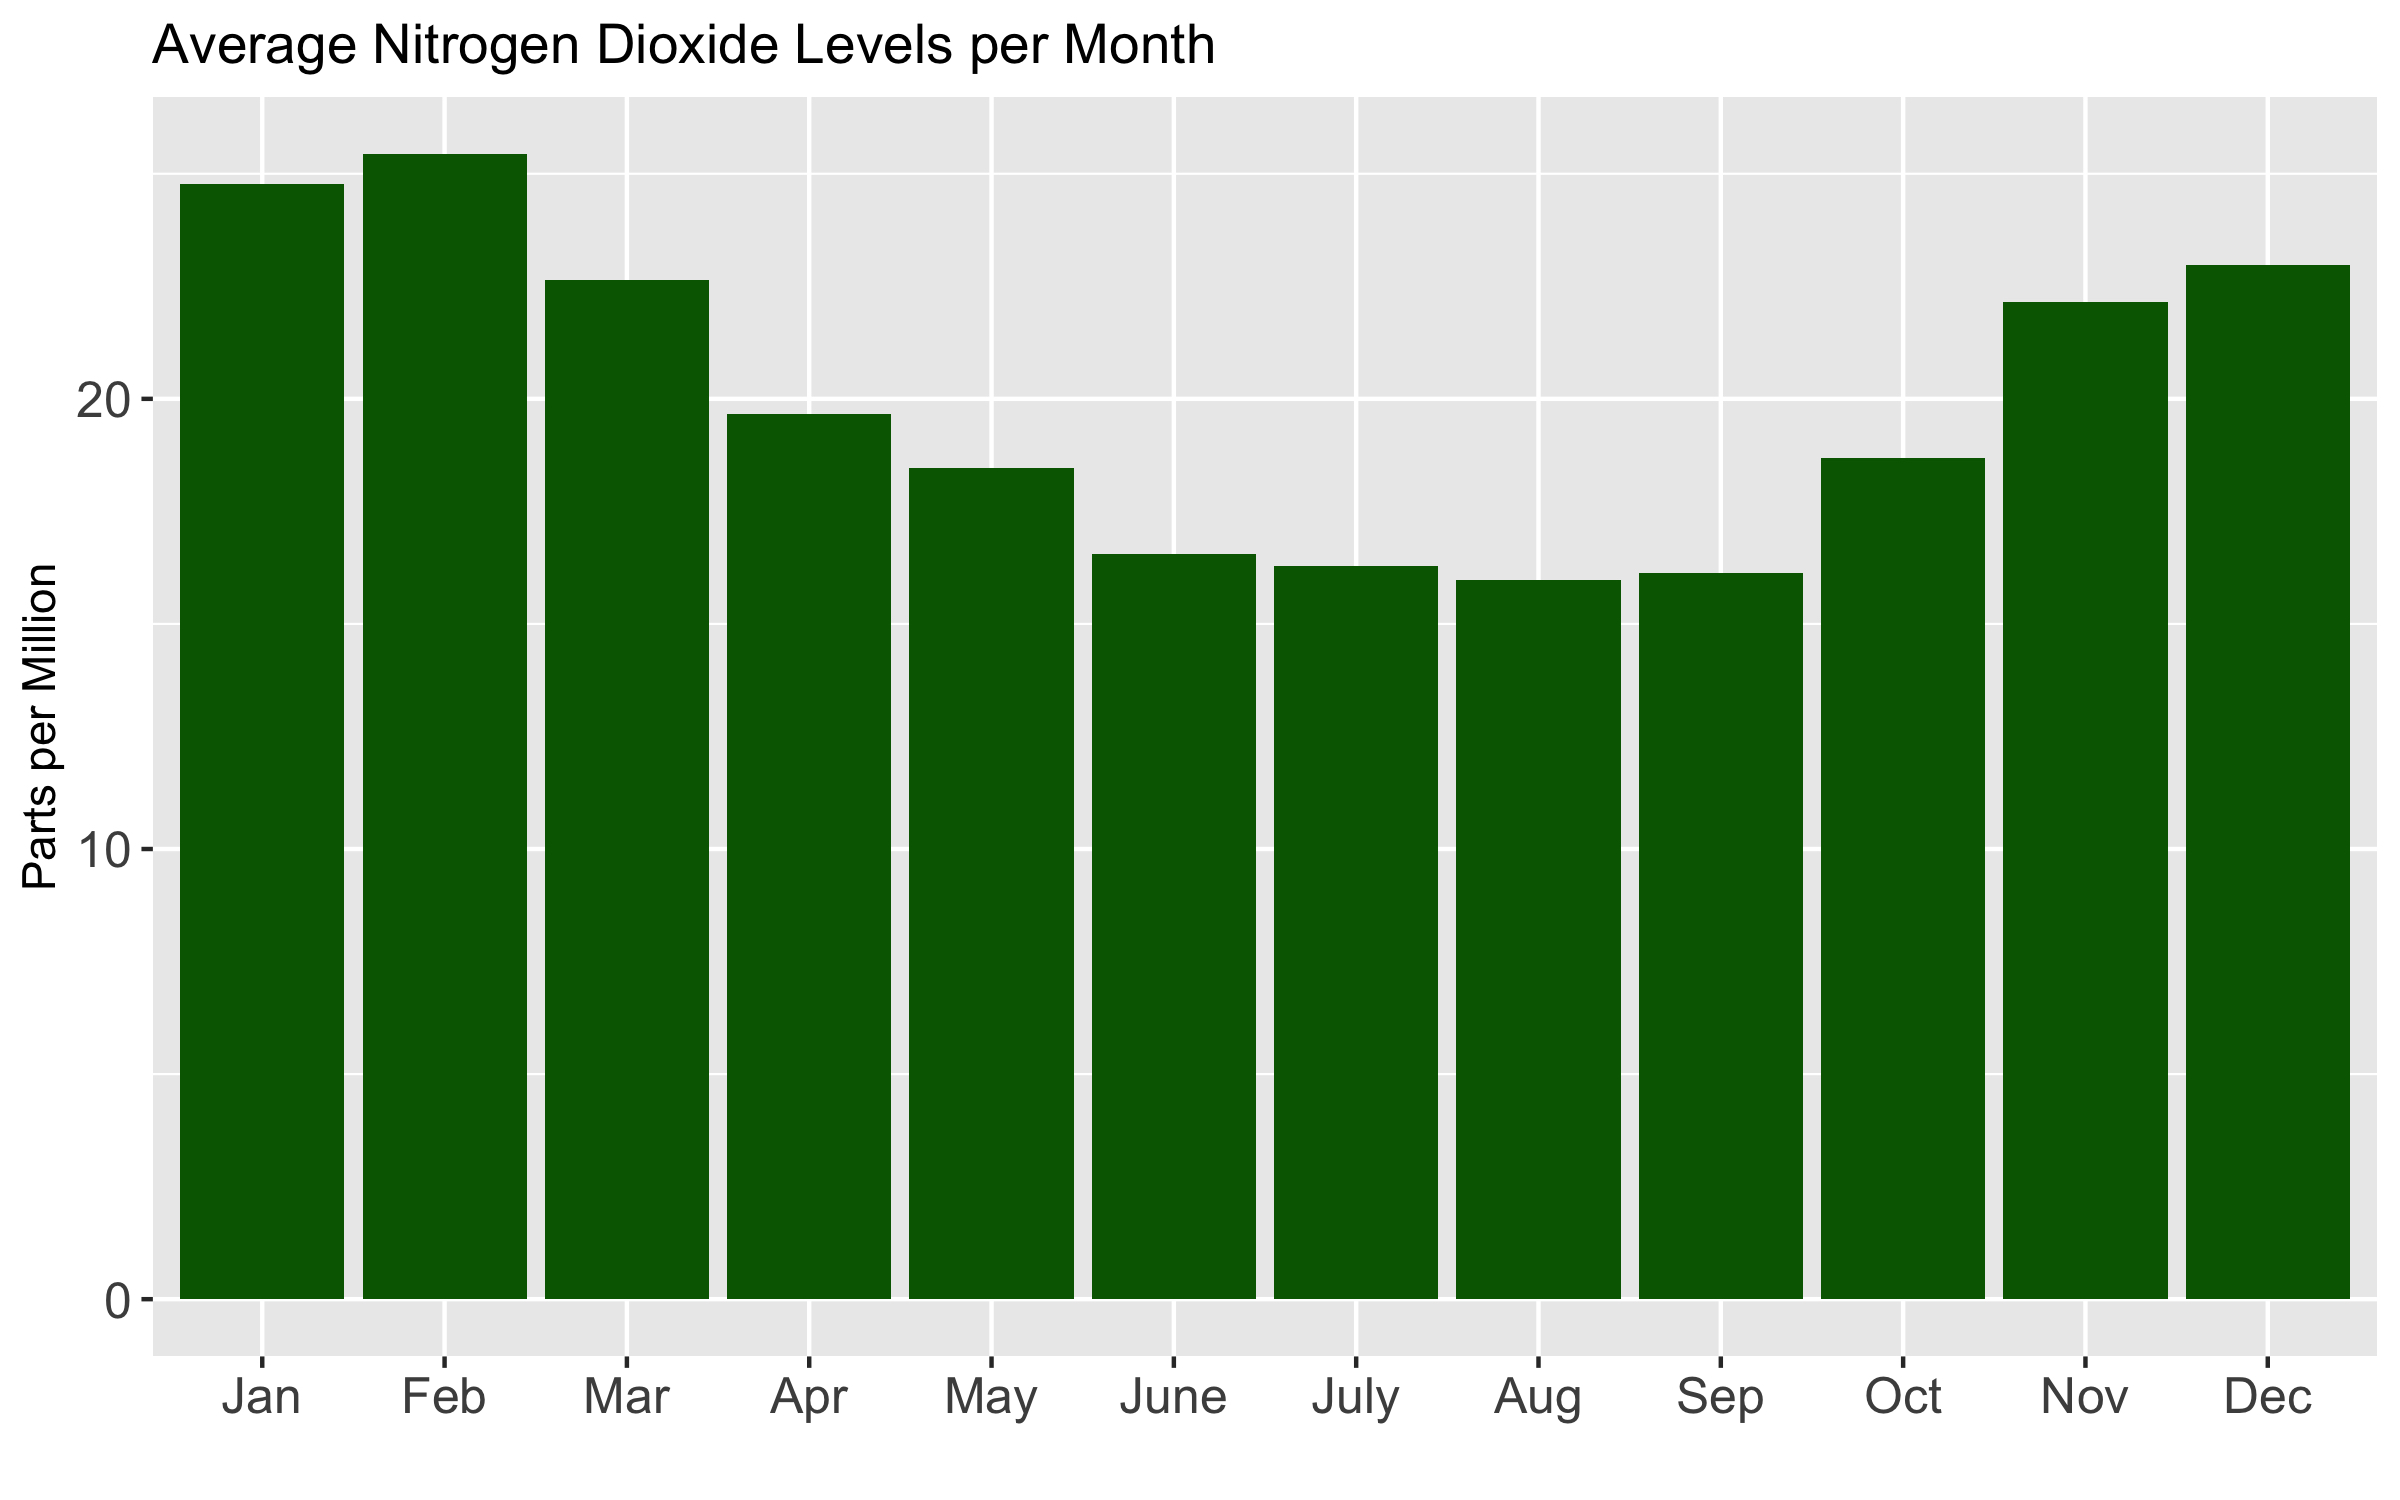
  • Researchers found an association between acute exposure to nitrogen dioxide and PM2.5 and increased incidents of completed suicide in Salt Lake County, Utah (Bakian et al., 2014).
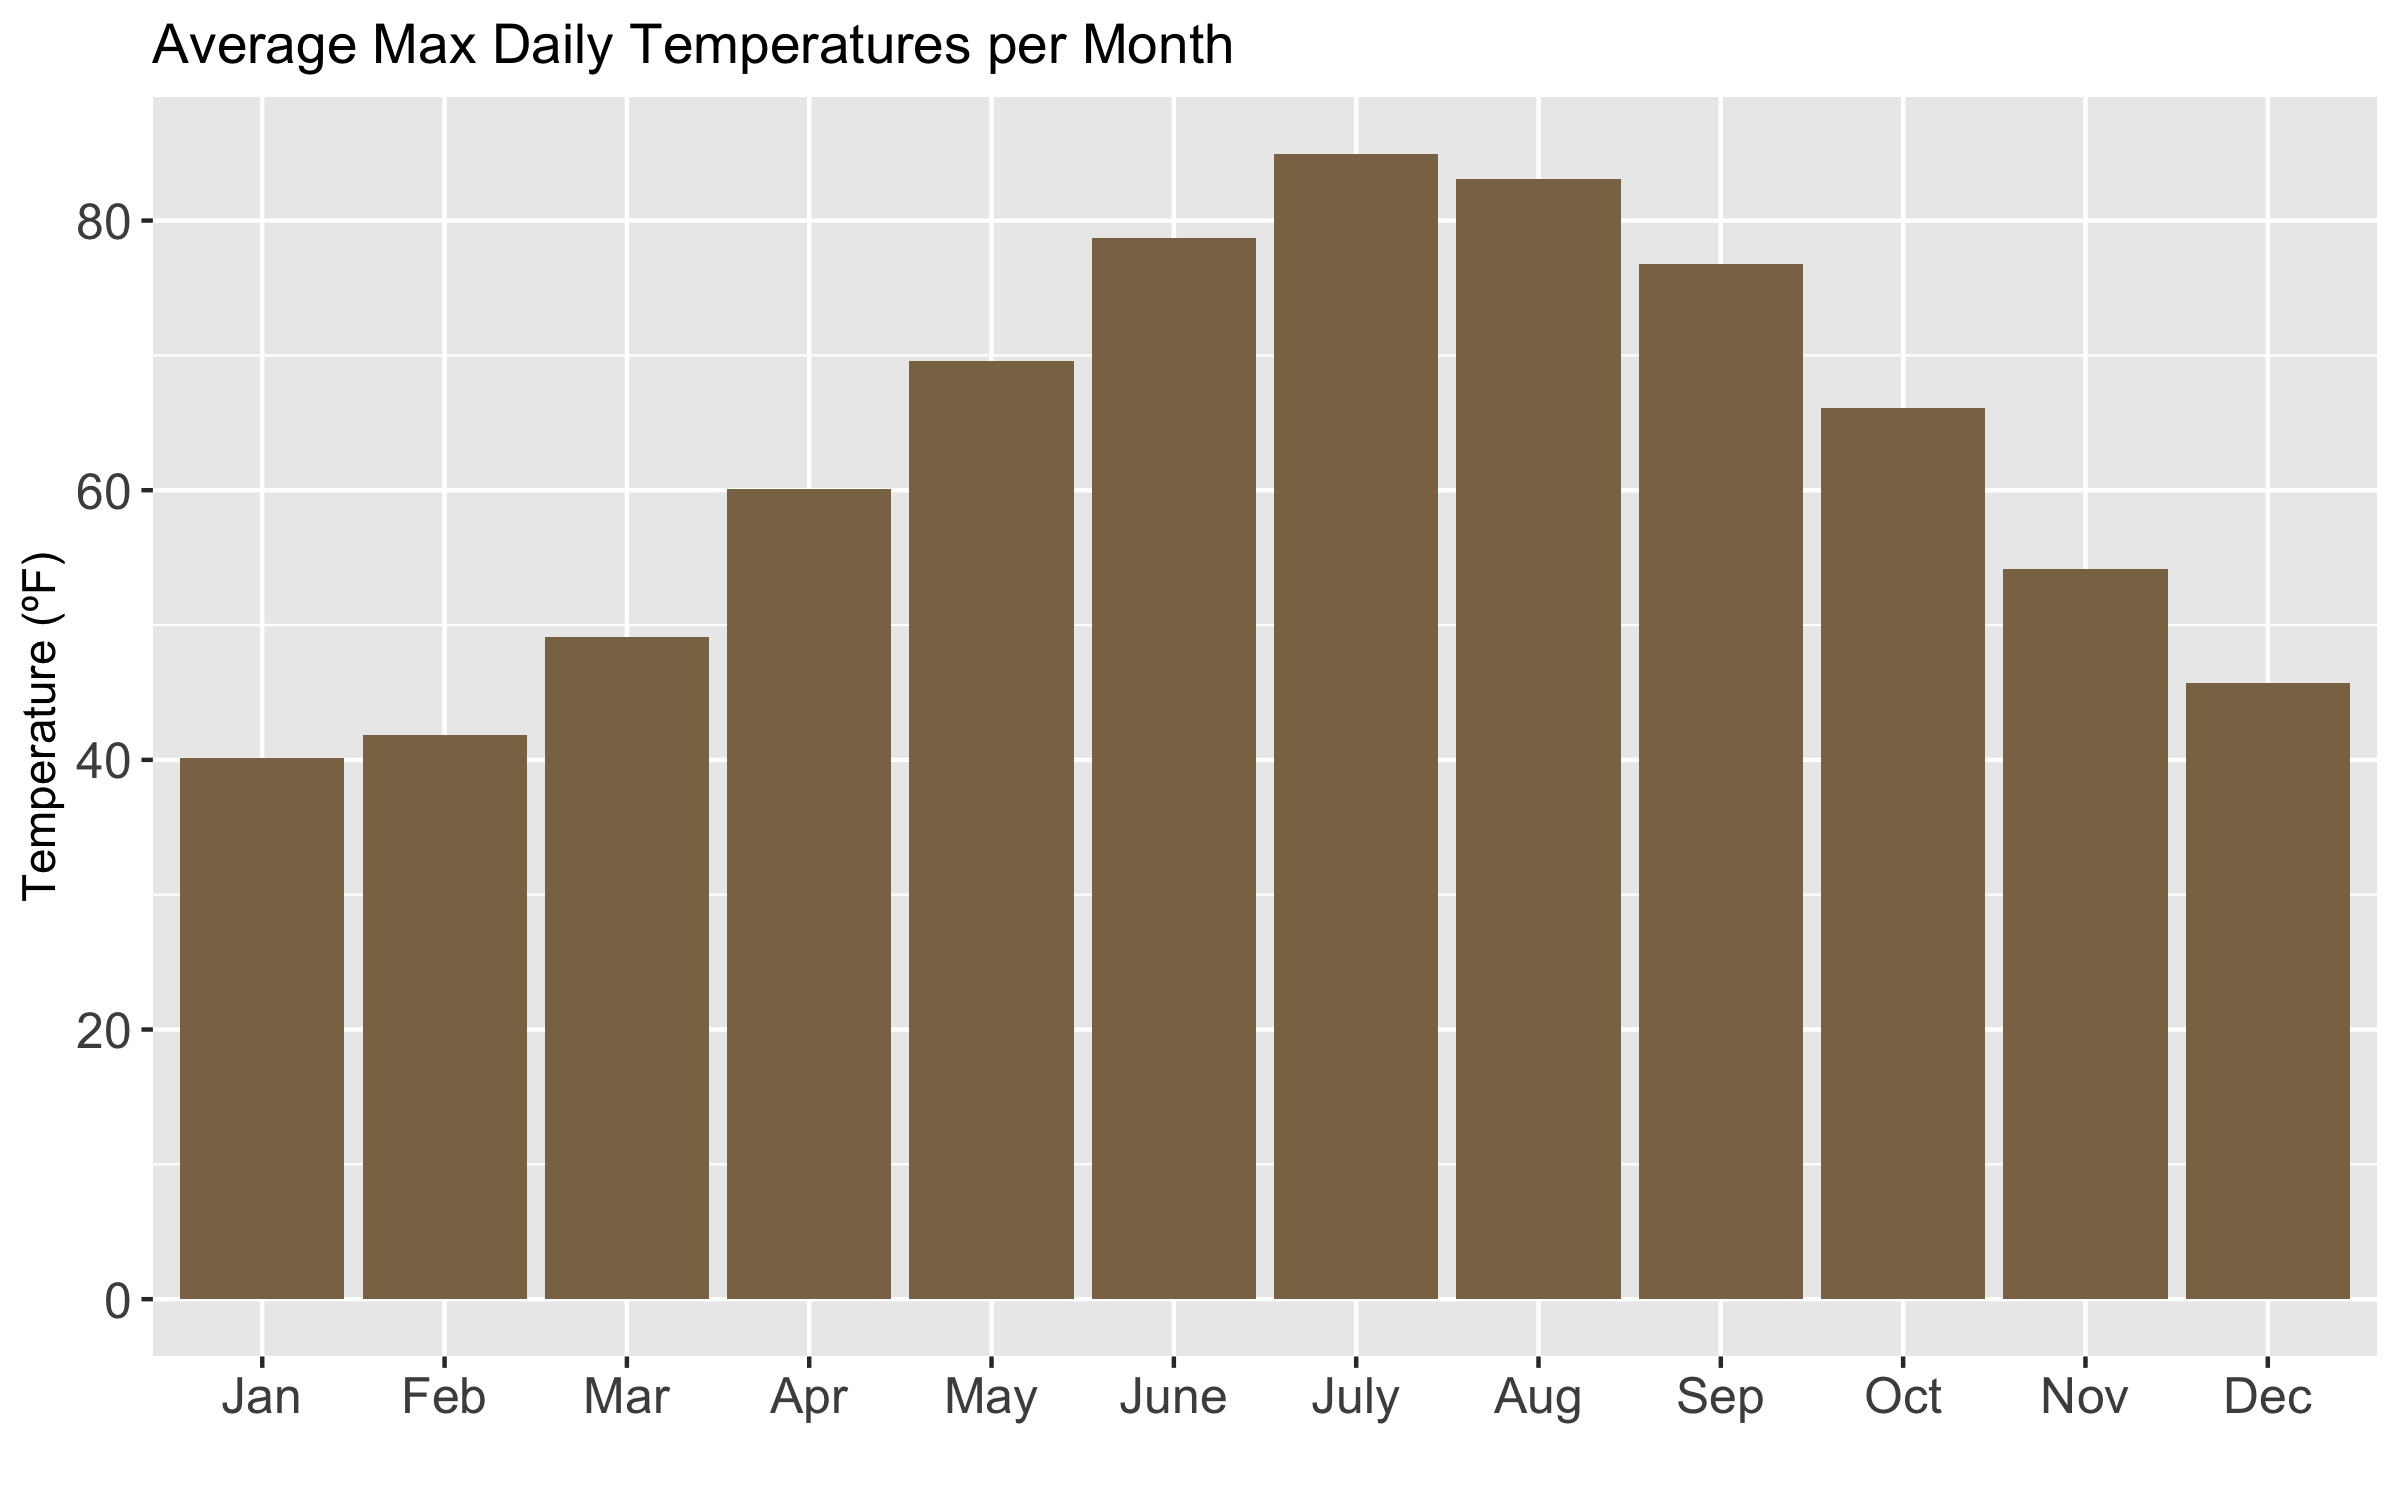
  • When evaluating maximum daily temperature, wind speed, and precipitation in Baltimore, Maryland, maximum daily temperature was the most important weather factor associated with violence and trauma, as measured by hospital admissions and police reports (Michel et al., 2016).
  • In the city of Taipei (Taiwan), controlling for changes in weather and unemployment, variations in ambient ozone levels explain roughly 23% of variation in the number of suicides. This relationship was particularly pronounced with suicide by violent methods (Yang et al., 2011).

Data Collection

Shootings in Bronx County Data

The data for all shooting incidents reported to the NYC police from 2006-2019 is freely available from the data.gov website. This includes detailed information for 21,626 reported shootings, including victim and perpetrator demographics, as well as times and locations.

Due to the availability of pollutant and weather information, and the desire to minimize the impact of geographic variations in the levels of pollution, the analysis was restricted to shootings which occurred in Bronx County.

Pollution Data

Collected from the United States Environmental Protection Agency.

Two sites within Bronx County provided the measurements for
the following air pollutants:

  • Carbon Monoxide
  • Sulfur Dioxide
  • Nitrogen Dioxide
  • Ozone
  • Particulate Matter <2.5 microns (PM2.5)

Weather Data

Collected from the National Centers for Environmental Information.
The John F. Kennedy International Airport in New York City
provides measurements for:

  • Maximum Daily Temperature
  • Precipitation (Rain)

Pollution data is recorded at the two marks within Bronx County. Temperature and precipitation are recorded at the JFK airport, designated by the lowest mark.

Exploratory Data Analysis


After visualizing the data, I could see that the distribution of shootings was highly skewed, with the majority days having zero reported shootings. The highest number of reported shootings was 19, with the median number of shootings being 1.

Feature and Temporal Characteristics

Prior to analysis, I investigated feature distributions and temporal patterns in the features. After plotting distributions, the distribution of sulfur dioxide was considerably skewed to the right, thus I chose to log transform the data to a distribution more comporable to the other features. Further, after visualizing the distribution of precipitation data, I chose to remove this variable from the analysis. The overwhelming majority of days had no precipitation, thus the imbalance of values may have a negative impact on the models.

Next my goal was to see if there were seasonal changes in the environmental conditions and numbers of shootings.

Here I found it interesting to see that levels of ozone and maximum temperature displayed an extremely similar seasonal pattern to the number of shootings, whereas sulfur dioxide levels were nearly the exact opposite, something to keep in mind.

Analysis and Findings

Poisson Regression

Because my dependent variable was a count measure (the number of shootings in a day), I chose the Poisson Regression for my initial analysis.

However when evaluating the results, I discovered that the model displayed considerable overdispersion, violating an underlying assumption of the Poisson distribution. This is problematic as it can cause the model to provide inaccurate estimates and significance values. One solution to this problem is the Negative Binomial Regression, which I evaluated next.

Negative Binomial Regression

After fitting a negative binomial model to the data, I was able to get a more accurate picture of the output with a more equitable dispersion.


Each of the environmental features display a significant relationship with the number of shootings which occur in Bronx County, except for the levels of ozone and PM2.5. Of those which are significant, all but nitrogen dioxide display a positive relationship.

In the figure above, the incident rate ratios (IRR) represent the factor by which the expected number of shootings would change when the chosen feature is increased by X units. The standard IRRs are associated with a change of one unit in the corresponding feature, however due to the wide range of nitrogen dioxide levels, maximum temperature, and barometric pressure, the corresponding IRRs were adjusted to display the expected change in the number of shooting incidents with a ten unit increase in these variables.

The variable most strongly associated with changes in the number of shootings was levels of carbon monoxide. The expected number of shootings were expected to increase by a factor of 2.08 when carbon monoxide levels increased by 1 unit. It should be noted, however, that the range of carbon monoxide values in the data is less than 2 units (parts per million)

It is interesting that ozone and PM2.5 are the pollutants in our analysis that do not show a significant relationship with the number of shootings, as other studies have found these specific pollutants to be associated with violence in their analyses. Regardless, the results of the analysis do provide further evidence that the daily levels of pollution and temperature exhibit a relationship with violence.

Github


References

Bakian, A.V., Huber, R.S., Coon, H., Gray, D., Wilson, P., McMahon, W.M., Renshaw, P.F. (2015). Acute air pollution exposure and risk of suicide completion. Am J Epidemiol. 2015 Mar 1;181(5):295-303. doi: 10.1093/aje/kwu341. Epub 2015 Feb 10. PMID: 25673816; PMCID: PMC4339389.

Burkhardt, J., Bayham, J., Wilson, A., Carter, E., Berman, J.D., O'Dell, K., Ford, B., Fischer, E.V., Pierce, J.R. (2019). The effect of pollution on crime: Evidence from data on particulate matter and ozone, Journal of Environmental Economics and Management, Volume 98, 102267.

Michel S.J., Wang, H., Selvarajah, S., Canner, J.K., Murrill, M., Chi, A., Efron, D.T., Schneider, E.B. (2016). Investigating the relationship between weather and violence in Baltimore, Maryland, USA. Injury, Volume 47, Issue 1: 272-276.

Yang, A. C., Tsai, S.-J., Huang, N. E. (2011). Decomposing the association of completed suicide with air pollution, weather, and unemployment data at different time scales. Journal of Affective Disorders, 129(1):275–281.

Younan, D., Tuvblad, C., Franklin, M. et al. (2018). Longitudinal Analysis of Particulate Air Pollutants and Adolescent Delinquent Behavior in Southern California. J AbnormChild Psychol 46, 1283–1293. https://doi.org/10.1007/s10802-017-0367-5

Data Sources

NYPD Shooting Incident Data (Historic) (2020). https://catalog.data.gov/dataset/nypd-shooting-incident-data-historic

National Centers for Environmental Information (2020). https://www.ncdc.noaa.gov

Environmental Protection Agency (2021). https://www.epa.gov/outdoor-air-quality-data/download-daily-data