Drug Repurposing for Alzheimer's Disease Using Graph Neural Networks


All analyses done using Python.

Introduction


Historically, neural networks in drug discovery used the fixed chemical properties of molecules as feature input into neural networks. These networks could then predict the efficacy/activity of a suggested compound given its chemical properties.

In 2020, Collins and colleagues [1] were able to utilize graph convolutions to produce trainable molecular features for use in their neural networks. These trainable features were then fed into a feed-forward neural network to predict the antibiotic activity of a compound against E. coli. This new utilization of graph neural networks to train molecular features led to the discovery of a novel antibiotic, one that was structurally unique to other antibiotics.

The use of neural networks to predict novel treatments of disease is widespread and includes many areas of medicine and disease. Alzheimer's Disease (AD) is one of the most impactful and prevalent diseases in the world, impacting an estimated 55 million people worldwide. Many hypotheses involving different genes, proteins, and other factors have been proposed as contributing to AD, however, two proteins have become notoriously associated with AD: the Tau protein and A-beta amyloid peptide (APP) [2, 3]. These two proteins contribute to the neurofibrillary tangles and amyloid plaques present in the brains of AD patients. Although considerable research has shown relationships between Alzheimer’s Disease and the dysfunction of these two proteins, there is little evidence that we can successfully reverse the dysregulation of these two proteins in-humans, with hopes of preventing the onset or the progression of the disease.

Using drugs pulled from the DrugBank Database [4], this project aims to employ the same strategy Collins and colleagues used to identify novel antibiotics, but with the goal of identifying drugs for the repurposed use of treating Alzheimer’s Disease.

Representing Molecules through Bits and Graphs


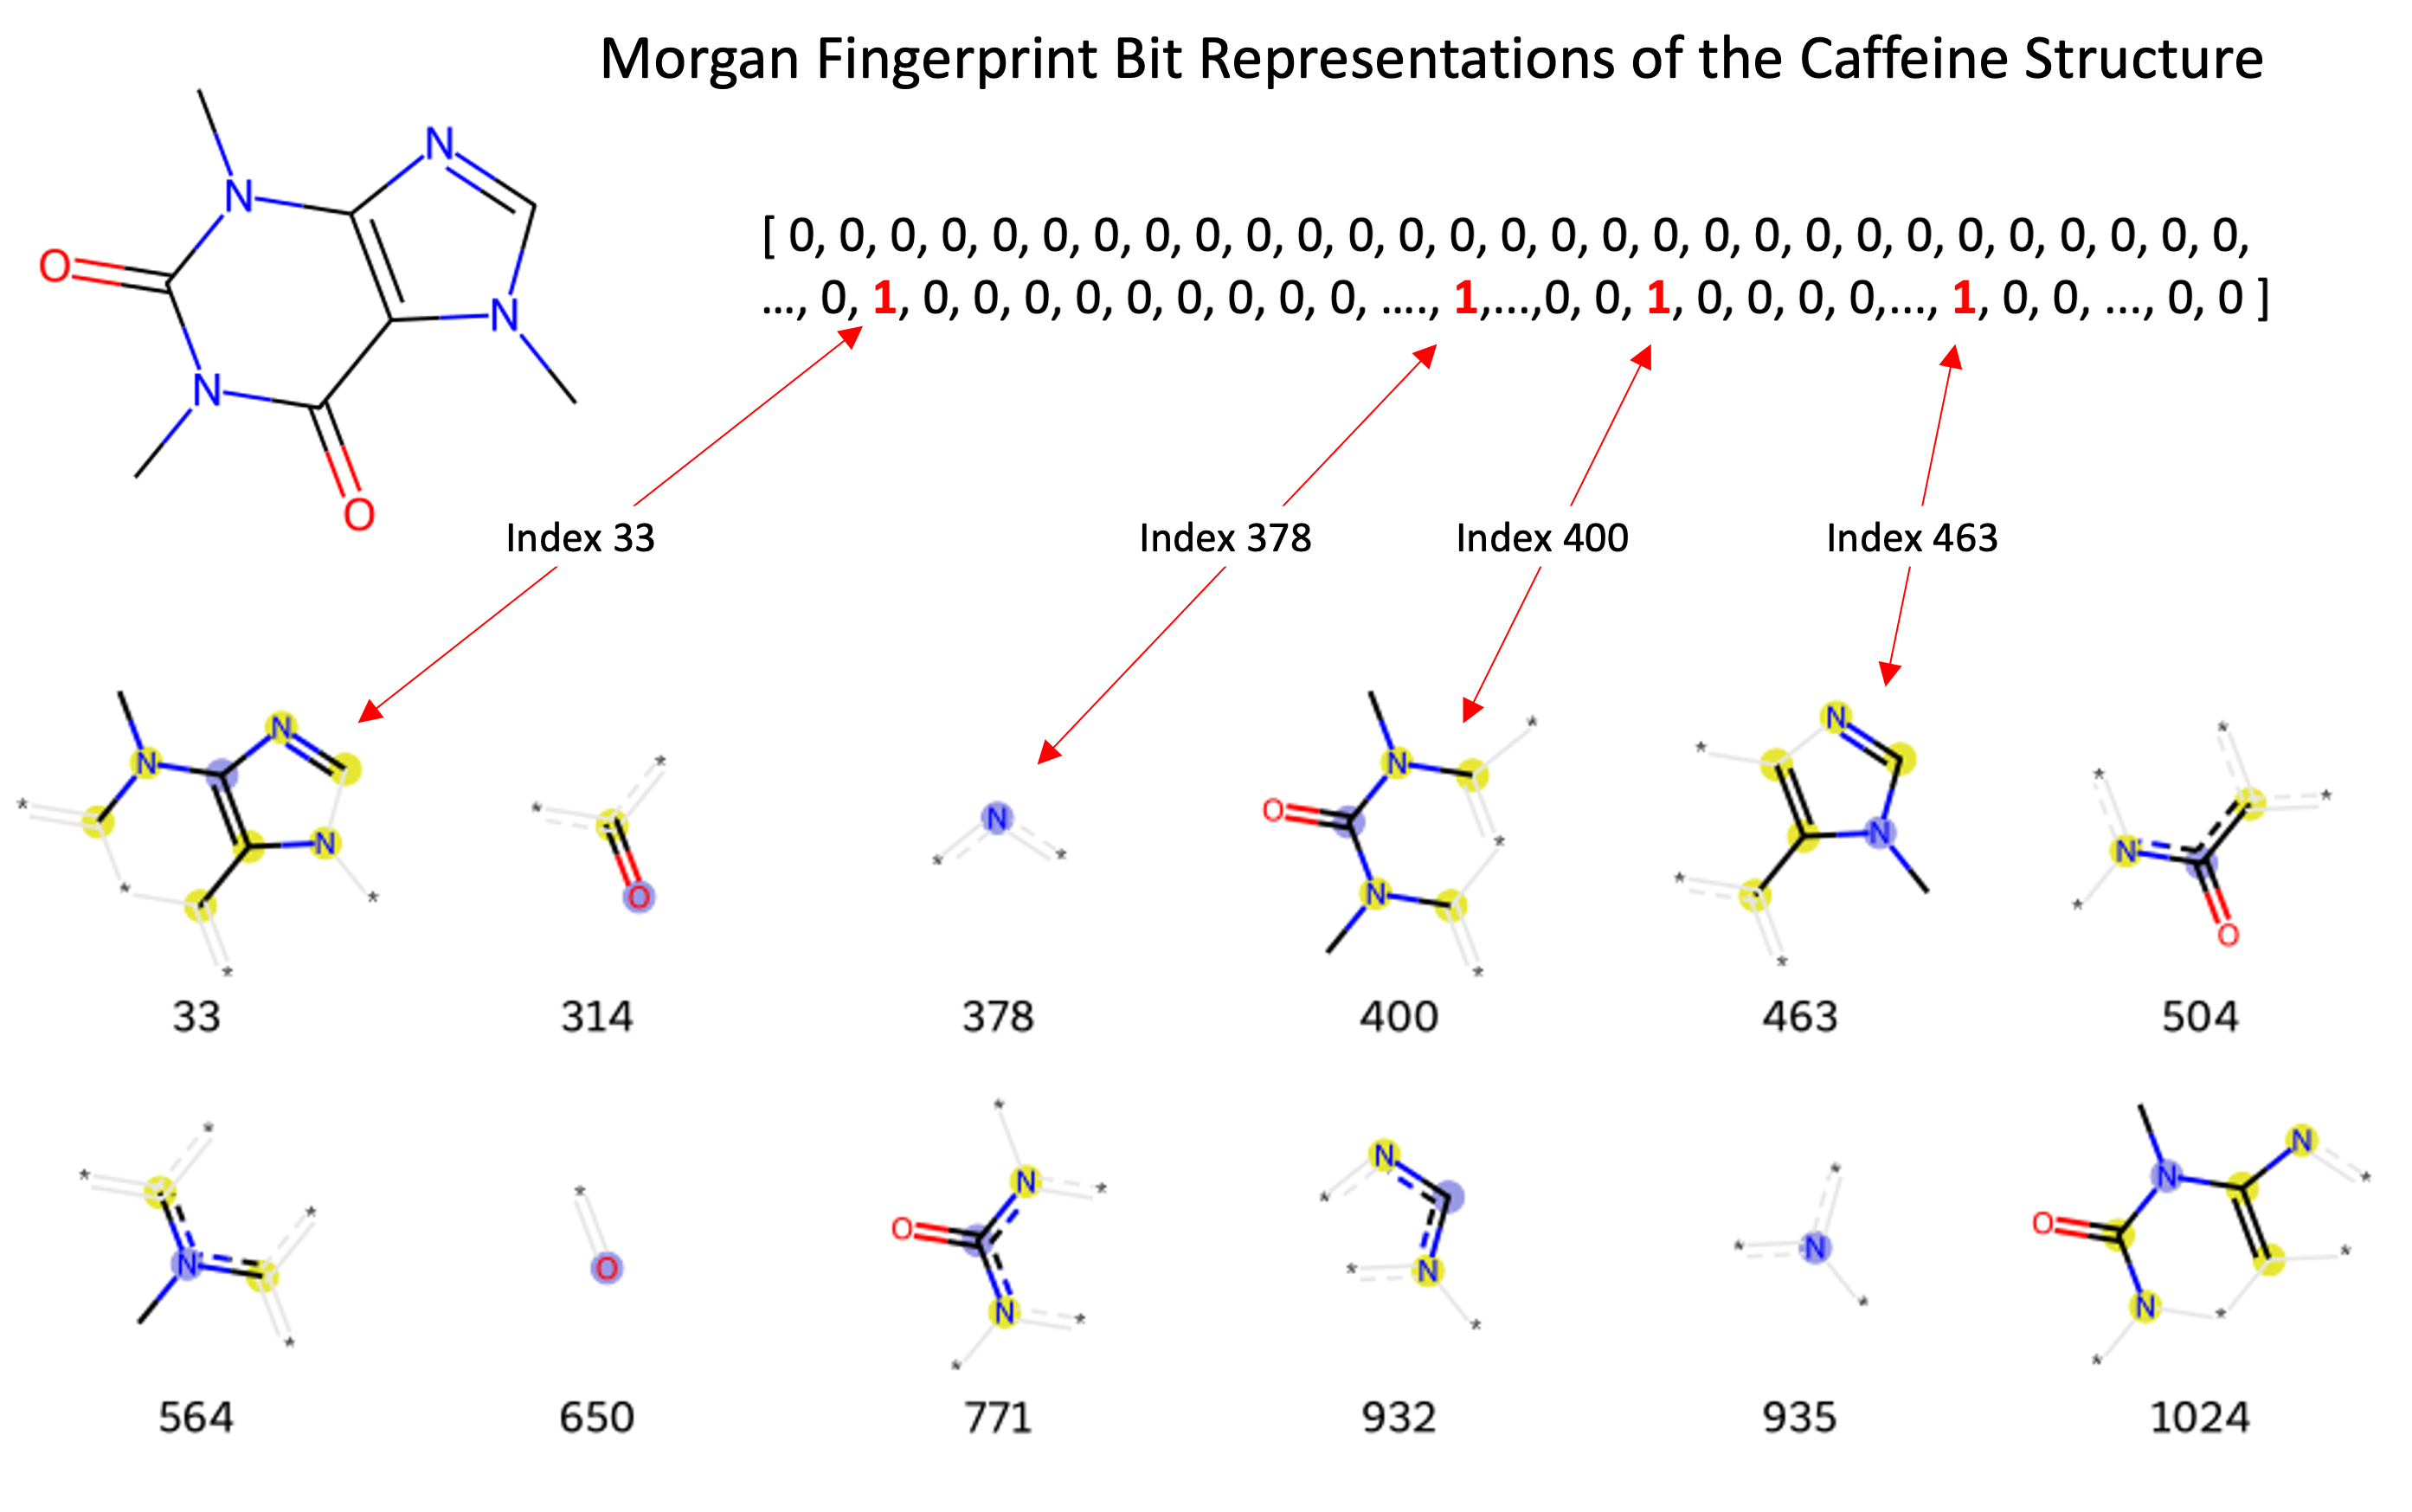
Many different identifiers have been developed for compounds, including the InChi, InChiKey, and SMILES. These identifiers are useful in different contexts, however, are not useful for most machine learning models. The Morgan Fingerprint was developed as a hashed representation of compounds that serve as fixed-length bit vectors (1s and 0s) in which molecular structures can be deduced. Typically, Morgan Fingerprints are generated in lengths of 1,024 or 2,048, with longer vectors providing more detailed structural breakdown. These bit vectors can be passed into machine learning models before being passed through and transformed within the model’s hidden layers. When generating a Morgan fingerprint, the substructures encoded within a vector are dependent on the fixed “radius” parameter encoding how many adjacent atoms are considered for substructure generation. This parameter limits the structural “awareness” across the molecule regarding the presence of functional groups that may be important when present further apart in the molecule. The image below shows fingerprints encoded with a radius of 2, where the encoded structures are built from neighboring atoms at most 2 steps away from the from the central atom highlighted in blue.


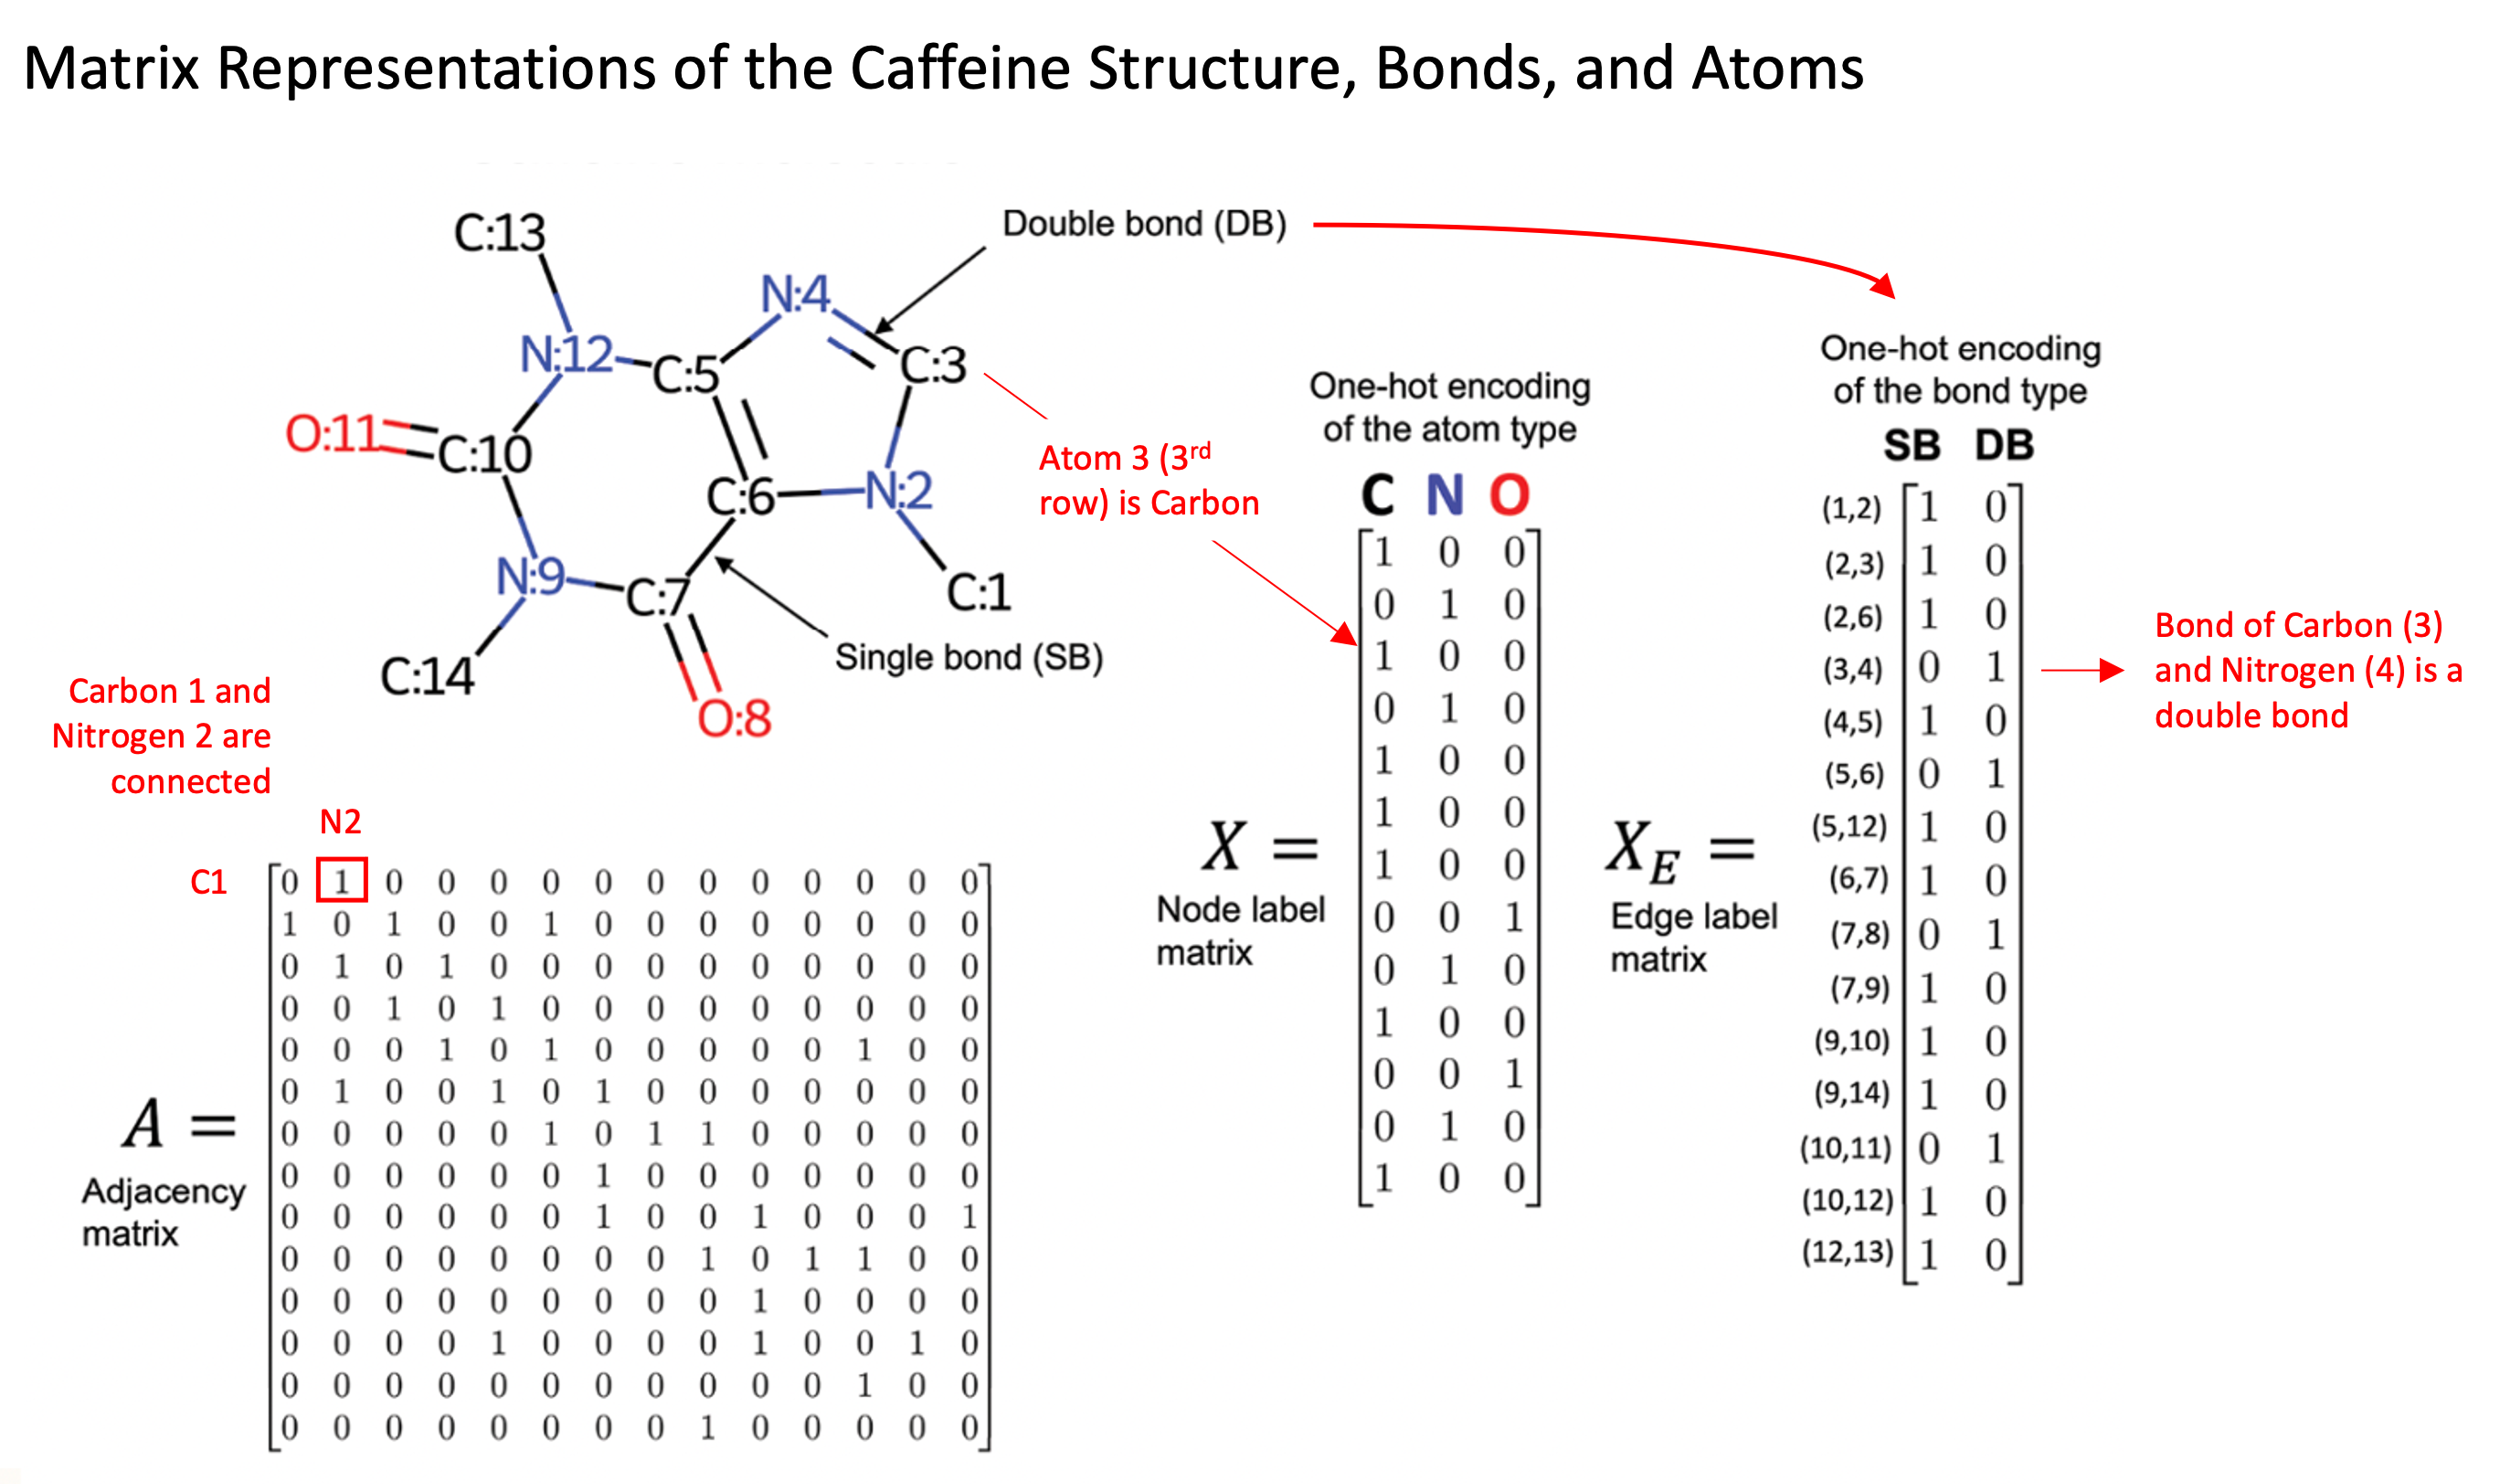
Although fingerprint representations of molecules are useful in some contexts, a more recent development is the representation of molecules as graph structures, where atoms are presented as nodes and bonds between atoms as edges. The use of these graph representations provides several advantages over fixed Morgan Fingerprints, such as the ability to learn spatial arrangements of atoms and to encode atomic and molecular features explicitly. The image to the [direction] illustrates the caffeine molecule represented through the adjacency matrix, node (atom information) matrix, and edge label (bond information) matrix. These matrices allow us to explicitly represent specific features of each individual atom and bond, such as the type of atom, number of protons, number of neighboring atoms, and bond types.


Graph Convolutional Neural Networks


Graph Convolutional Neural Networks (GCN) are a specific type of Graph Neural Network, and build on many of the features of Convolution Neural Networks (CNN) typically used on images. Graphs however serve as more flexible structures that more easily handle variations in input data, in comparison to CNNs which largely work with fixed size image vectors (i.e. 64 x 64-pixel images). The ability to handle variable size inputs is essential for GCNs to fully evaluate molecules. Current small molecule drugs are as small as a single atom (i.e. Lithium) and grow upwards of 37 heavy atoms [5], providing an enormous-range of potential graph sizes and shapes.

Many different GCN architectures exist, but are often in general composed of input layers, hidden graph convolutional layers, pooling layers, and subsequent feed forward / fully connected layers to provide predicted outputs.

The graph convolutional layers are one feature that makes GCN’s unique and especially useful. These layers lead to the model learning of expanded neighborhoods of atoms, known as message passing. As nodes are often only connected to a small subset of other nodes in the graph set, a single graph convolution layer only incorporates information from nodes a single step away. This is when multiple graph convolution layers become useful, as each additional layer allows the passing of information from one node “further”, enabling more distance nodes to influence the values of a node of interest deeper in the network.

For a more explicit example, we can consider this in respect to the caffeine molecule in the image above. Each atom’s encoding will be updated at each layer of the network. When Carbon C:7 is updated in the first graph convolution layer, it will aggregate information from its adjacent neighbors, Oxygen O:8, Nitrogen N:9 and Carbon C:6. When the Nitrogen N:9 is updated, it will take aggregate data from Carbon C:10 and Carbon C:14. This will be done for each atom in the molecule to complete the first convolutional layer. In the second convolutional layer, when Carbon C:7 is aggregating information from its neighbors, information from the updated Nitrogen N:9 will represent the original Nitrogen atom, but with influence from its own adjacent neighbors, Carbons C:10 and C:14. Therefore, this convolutional layer led Carbon C:7 to learn from atoms another step further away than its immediate neighbors. As the number of convolutional layers increases, each layer increases the number atoms away that the updated value accounts for.

Another important feature of graph convolutional networks are the pooling layers. The pooling layers can be of different types, including mean, min, and max pooling. These all serve the purpose to consolidate information from a neighborhood of atoms, with each type emphasizing different values within a neighborhood. In the case of max pooling, the pooling layer will extract the maximum feature values out of adjacent atoms in each neighborhood, emphasizing the most prominent atomic features. These features may include properties such as the number of bonds connected to each atom, the number of protons, the chirality of the molecule, or the atom type.

The last layer or layers of a graph neural network is typically a feed-forward (dense) layer, in which the logits of the model are produced and fed into a final softmax function. In a classification task, this softmax function produces the final class probabilities, which are then classified based on the chosen classification threshold. In this project, the class probabilities are split between two binary labels: whether the molecule will inhibit the expression of Tau or APP.

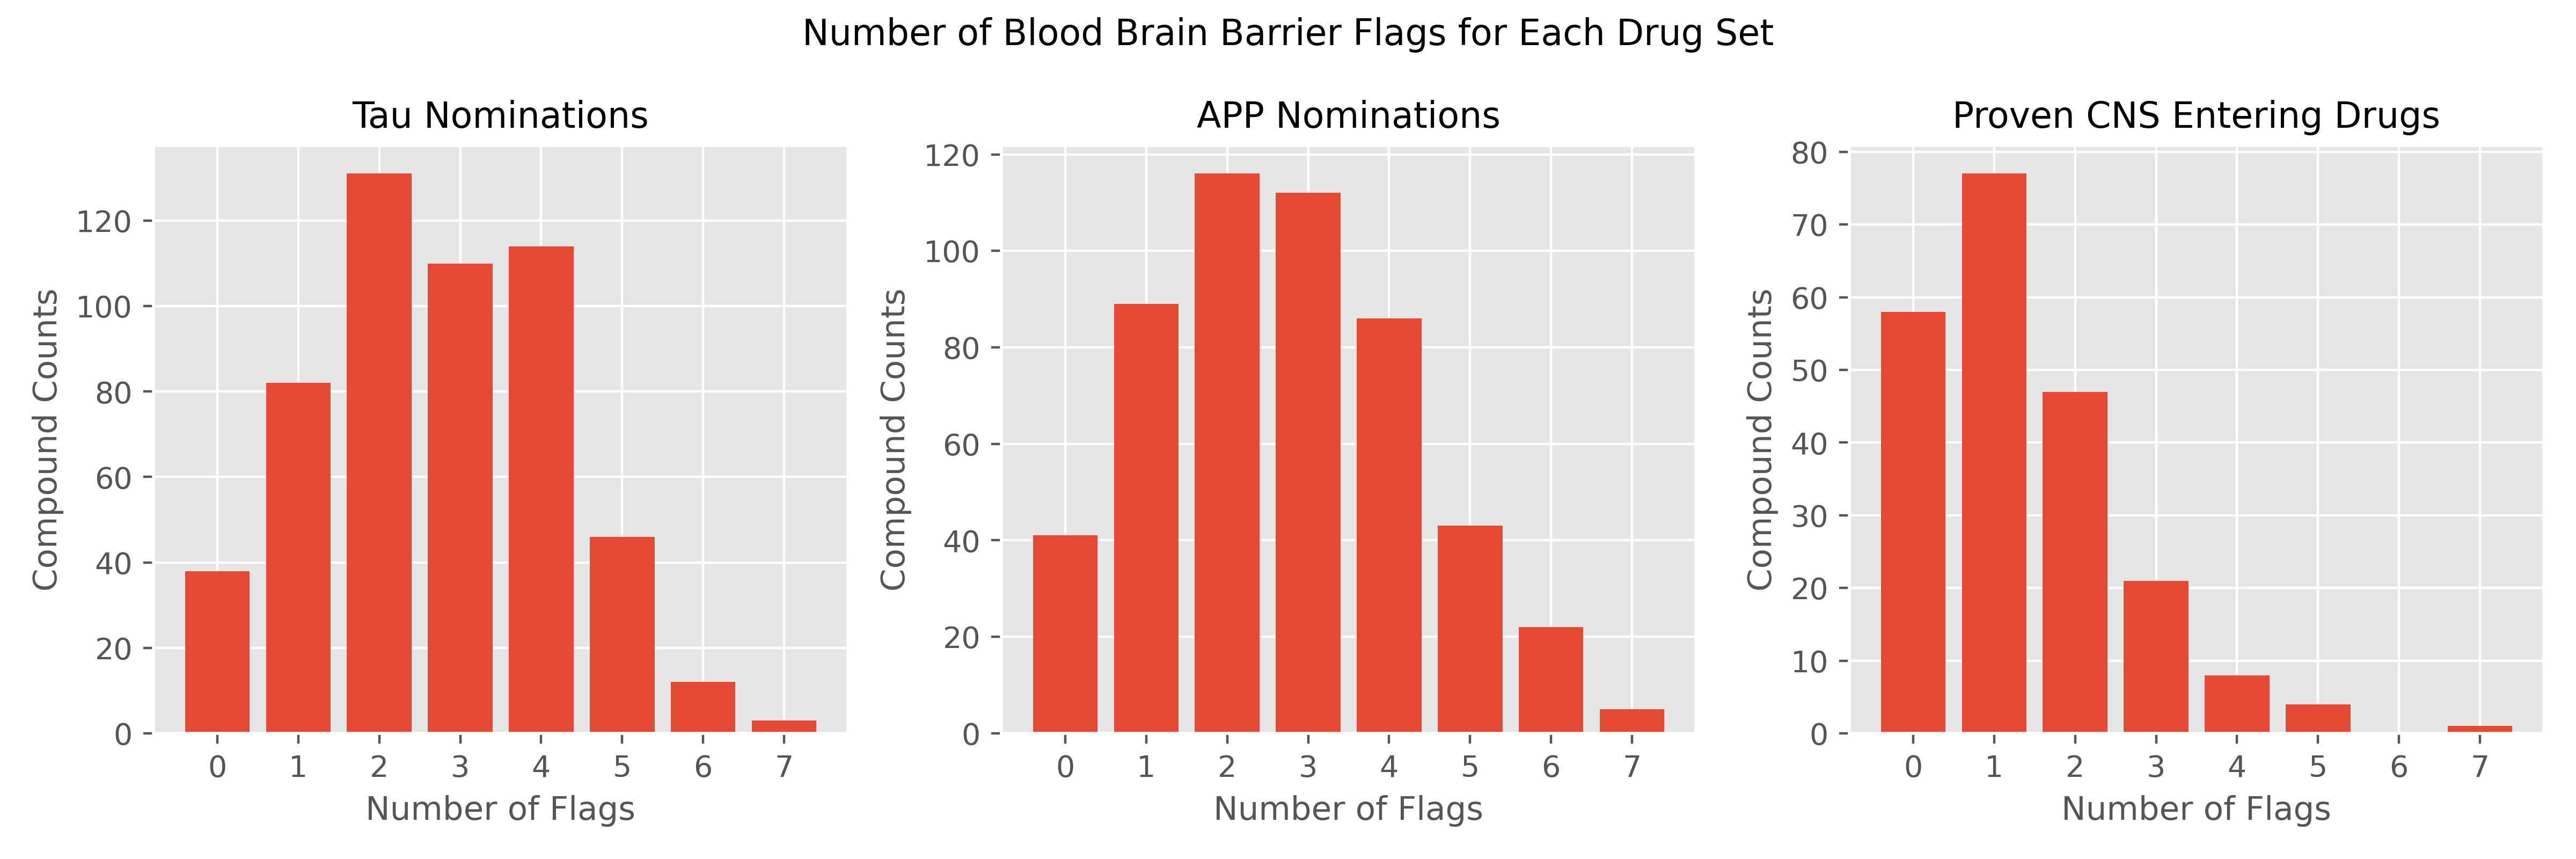
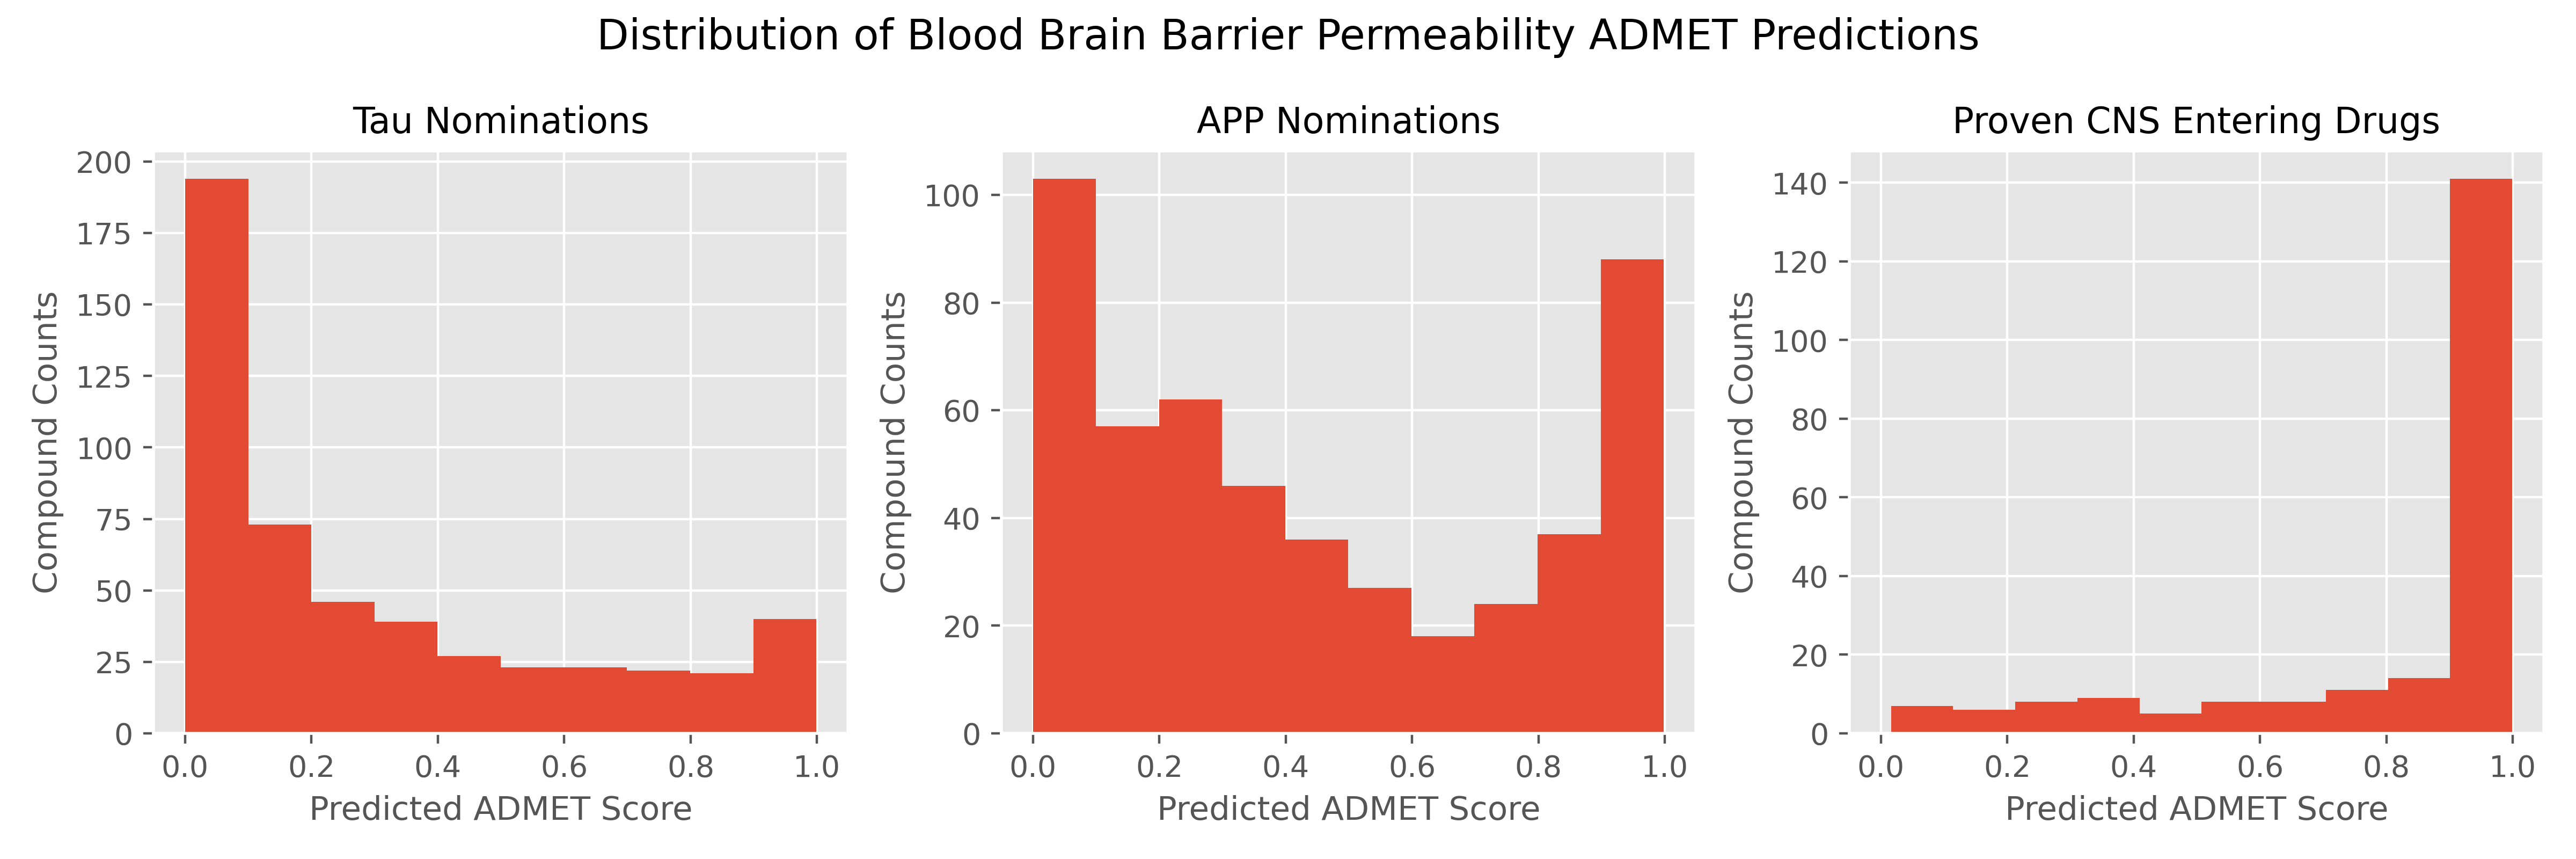
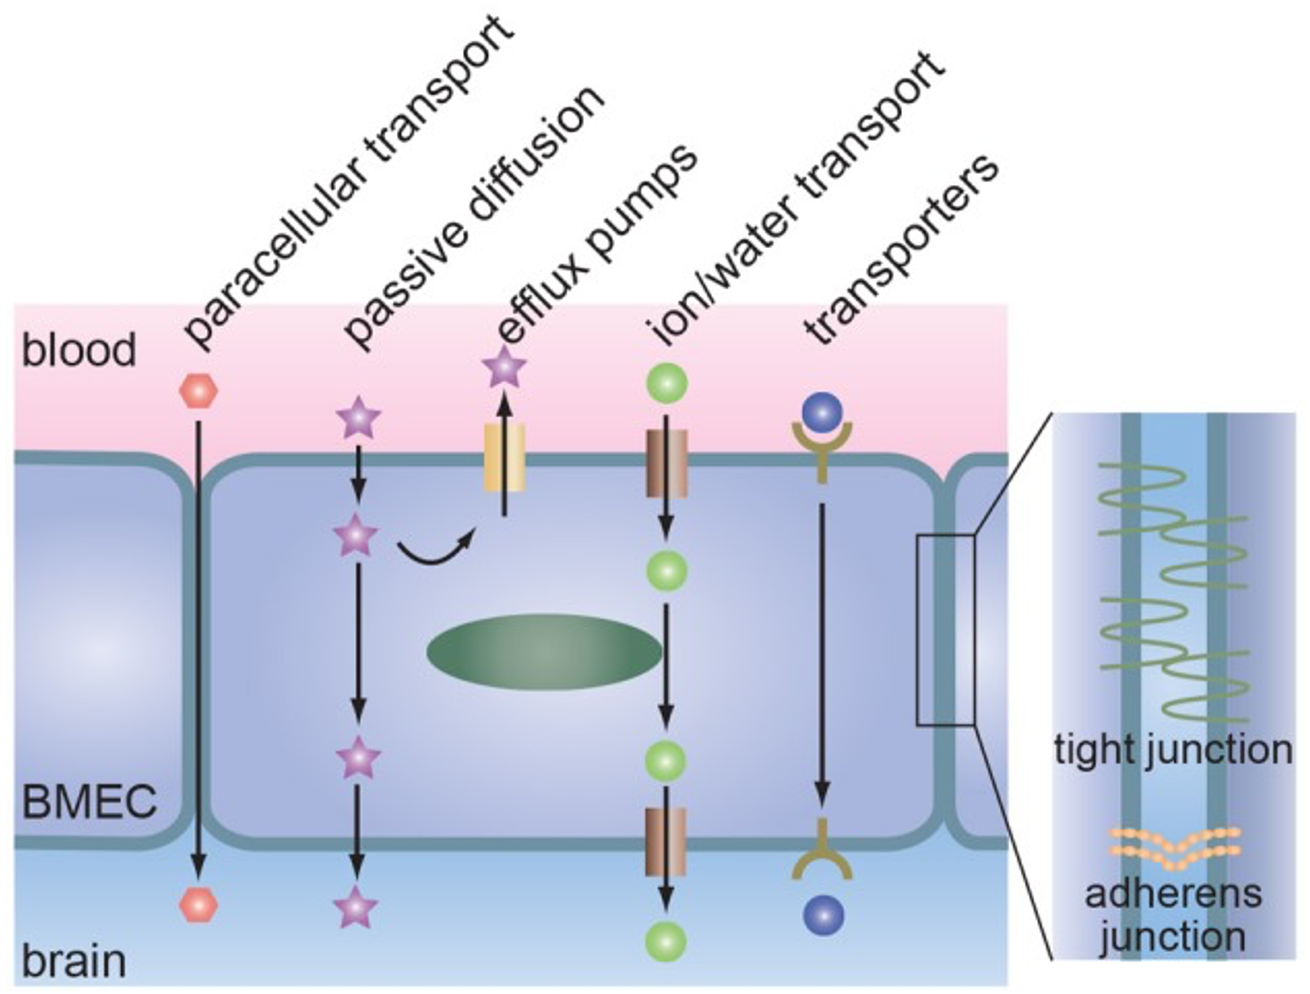
An Introduction to the Blood Brain Barrier


There are many factors that are involved in creating a successful drug. Not only must a molecule perform a desired effect on a target, such as inhibiting levels of Tau fibrils, but the drug must reach its appropriate location in the body, at an appropriate concentration, and avoid breakdown until the desired effect at the desired magnitude has been made on the target.

Drug development targeting the central nervous system makes this process even more difficult. The properties of the blood brain barrier (BBB) prevent the access of 98% of small molecules into the brain [7], limiting the compounds that are effective in clinic. For drugs that aren’t easily able to access the CNS, considerable effort must be made to overcome these limitations, such as medicinal chemistry modifications of the molecules, different methods of delivery (i.e. intranasal), or ligand-based delivery.

What makes accessing the CNS difficult for most molecules is due to the unique properties of the endothelial cells composing the BBB. In other areas of the body, there are multiple ways that small molecules can pass through these membranes, including paracellular transport (squeezing between gaps of adjacent cells), passive diffusion (slipping through the cell membrane lipid bilayer, thus traveling through the cell to reach the target tissue), as well as using various transporters to cross into the cell (protein receptors on the cell surface can facilitate transportation of extracellular molecules into the cell).

The difference in the cells lining the BBB, however, largely limit the ability of small molecules to use these mechanisms to enter the central nervous system. Many differences exist; however, two examples of these differences are the existence of tight junctions and the high expression of efflux transporters.


Your Image

Schematic of the endothelial cells lining the blood brain barrier from Wong et al. [6]


Tight junctions refer to the space between adjacent endothelial cells making up the blood brain barrier. These endothelial cells highly express specific membrane proteins which connect adjacent cells in an extremely tight and secure manner. These tight junctions between adjacent cells minimize any space that molecules can squeeze through into the brain and contribute to the considerable molecular size limitations for most molecules to pass into the central nervous system.

Endothelial cells of the BBB also express a high number of proteins called efflux pumps. These membrane proteins take molecules that have entered the cell and pump them back out into the blood, preventing the molecules from passing through the other side into the CNS. Not only do small molecules have to find ways to cross the lipid bilayer from the blood into the cell, but once they enter the cell, they must avoid getting thrown back out into the blood vessels by these efflux pumps.

These are just two examples of properties of the blood brain barrier that make the development of CNS targeting drugs so difficult, but in this project, I will try to account for the BBB as I proceed through the nomination process and prioritize compounds by their molecular properties.

Data

Training Data
Binary labeled training data was acquired through publicly available bioassay data from PubChem. Bioassay records for Amyloid Precursor Protein and Tau were associated with PubChem BioAssays AID1285 and AID1468 [8, 9].

For the APP inhibitory assay 193,714 compounds were tested with only 1,590 (0.82%) showing inhibitory activity. Activity was based on % inhibition of an in-vitro screening assay, where compounds inhibiting expression of APP by 45% or more at 2 uM concentration were labeled as biologically active.

For the Tau fibril inhibitory assay 271,042 compounds were tested, however 19,420 compounds returned inconclusive results and were dropped from the analyses. Out of the remaining 251,982 compounds. 1,025 (0.41%) of these compounds indicated inhibitory activity against the target. Activity was based on a series of dose-response assays and a score using the multiple screenings was calculated. Compounds with scores >= 40 were labeled as biologically active.

There was considerable overlap between the two assays, with 264,965 total compounds tested after combining the datasets and removing duplicates. Thirty-one compounds displayed inhibitory activity against both APP and Tau.
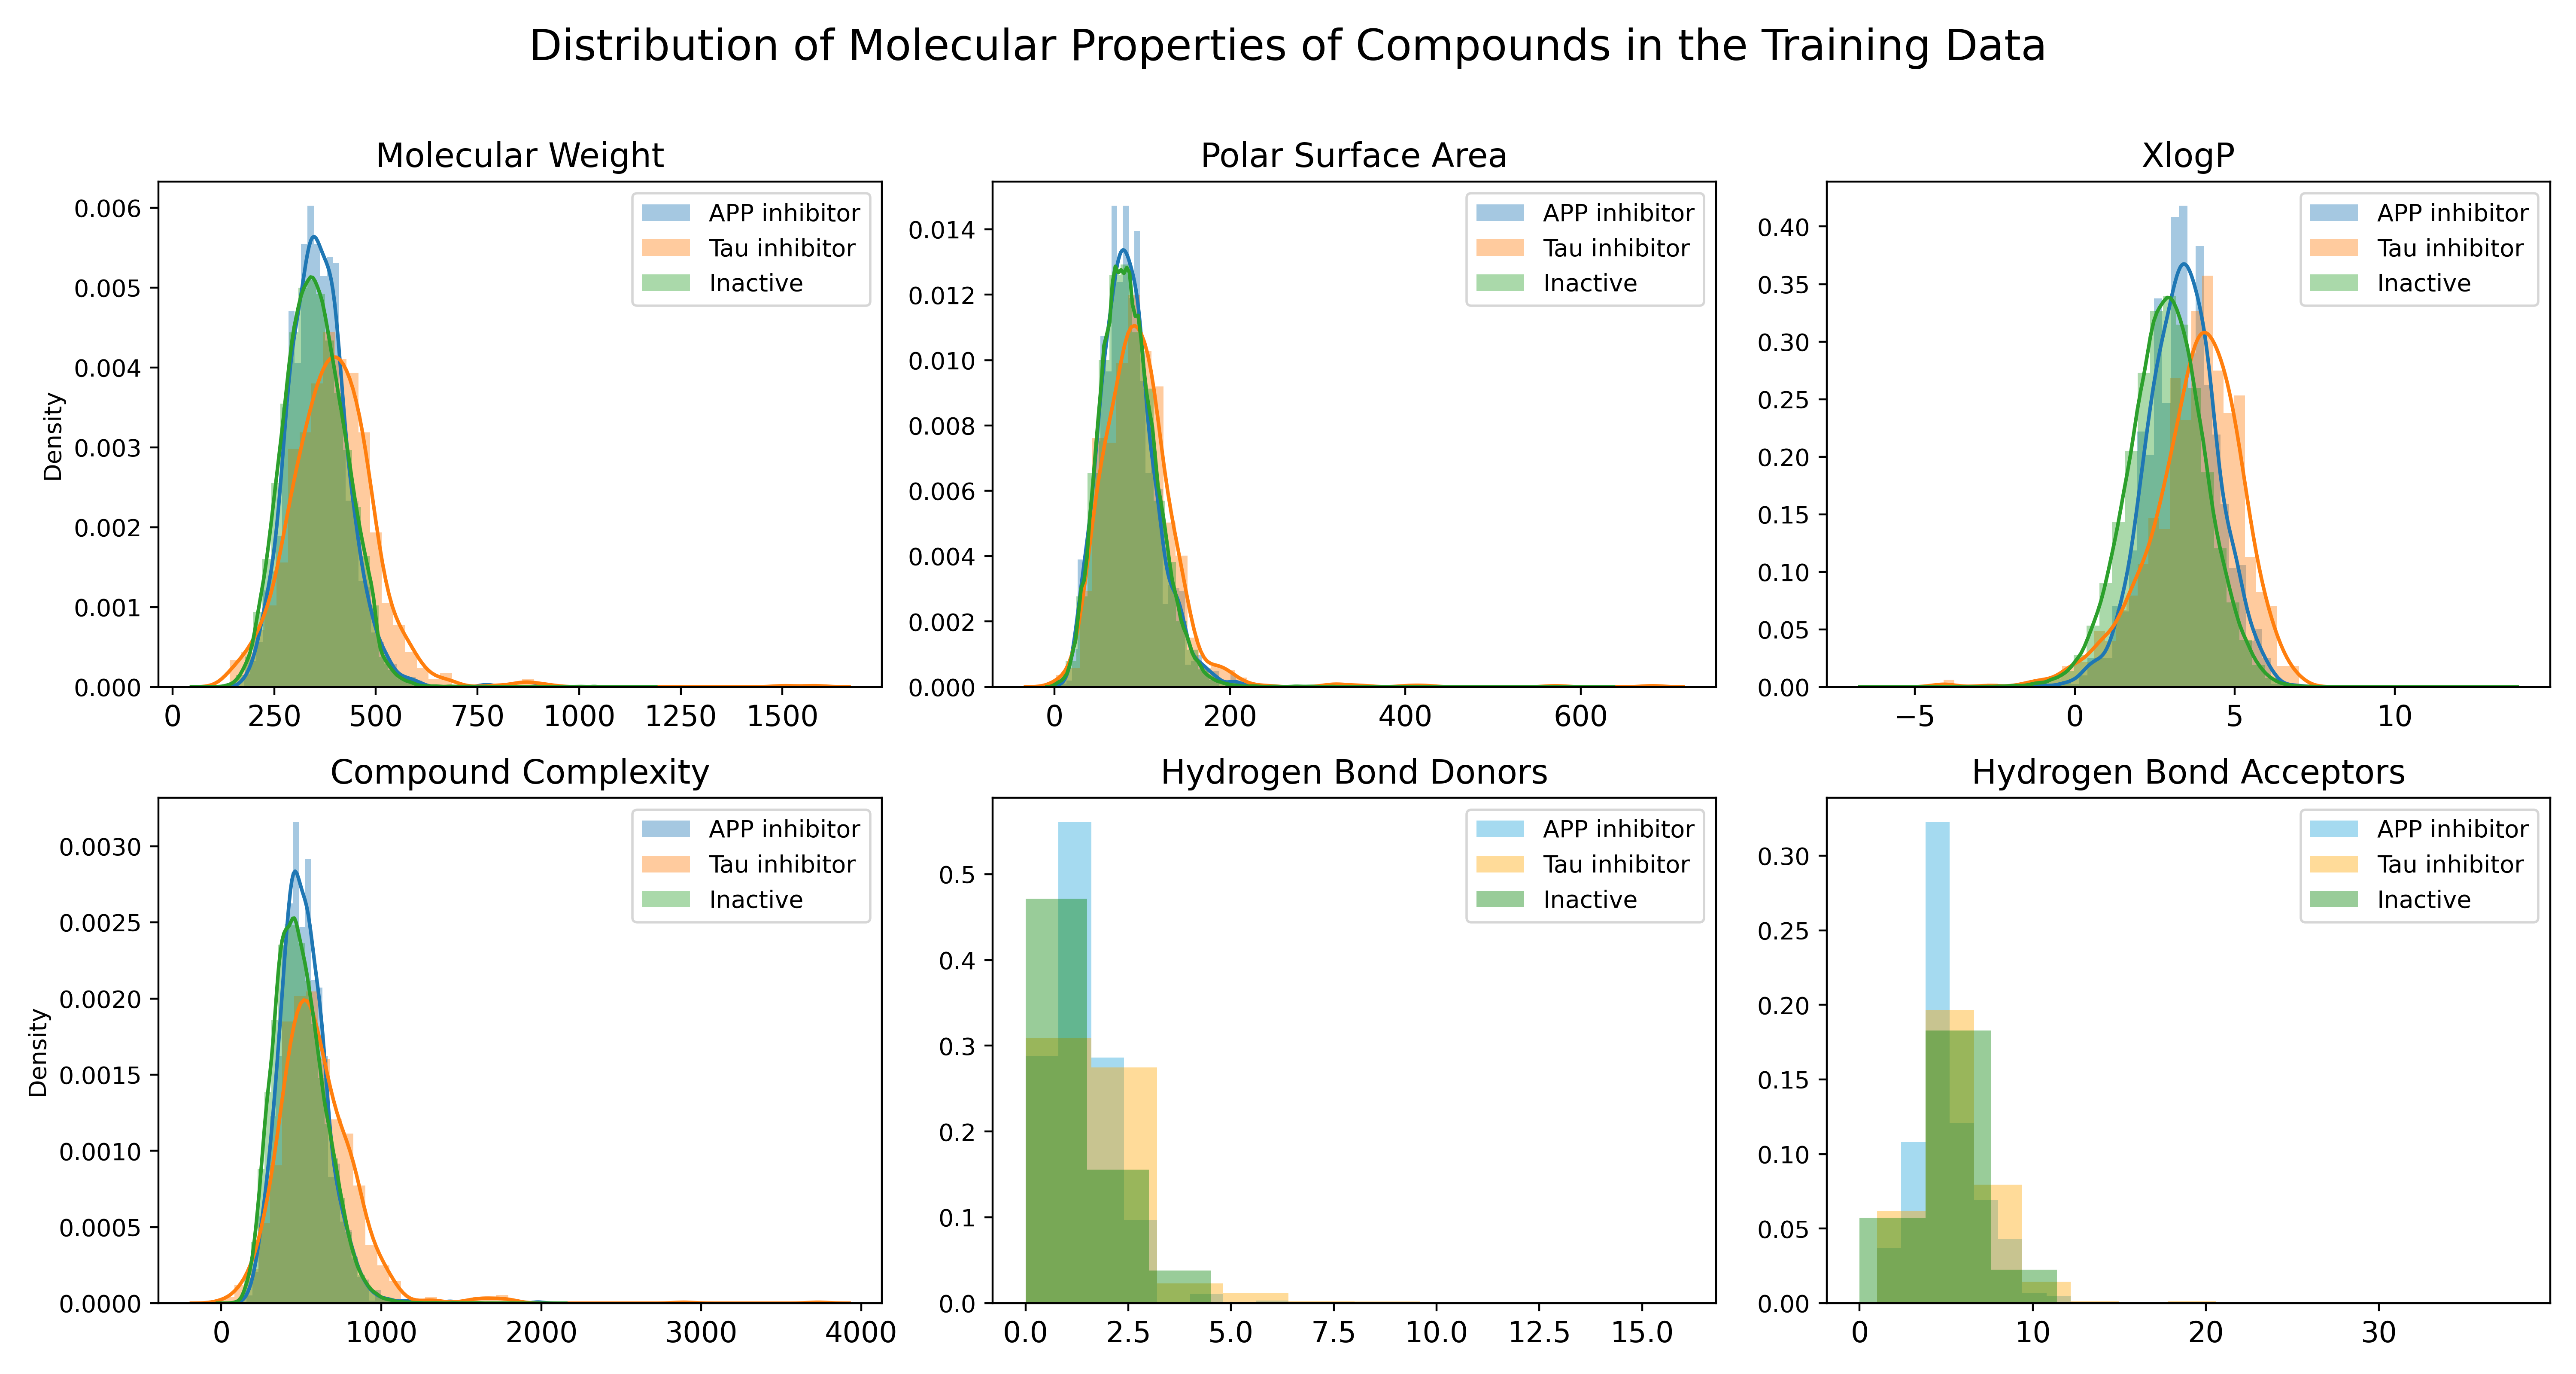
Descriptive Data
ChEMBL and PubChem were used for accessing descriptive data for the compounds in this study, such as molecular weight, the number of aromatic rings, and the solubility of a compound.

Prediction Set
DrugBank (9,468 compounds) includes approved, experimental, investigational, and illicit drugs in their database. 1,027 approved drugs are included in the data set, where the “approved” designation indicates that at some point in time the drug was approved for use somewhere in the world.

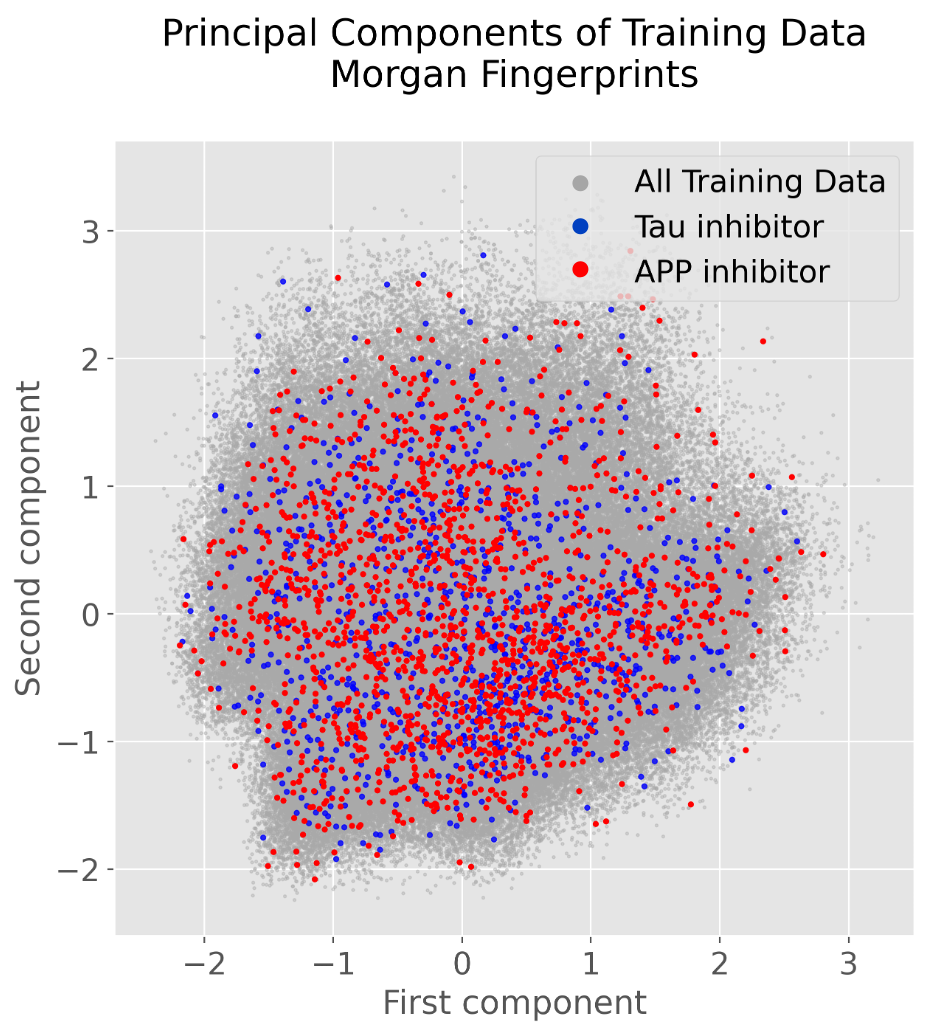
Exploratory Data Analysis


The first area of interest was to evaluate the basic molecular properties to determine if compounds actively inhibiting Tau or APP displayed differences to the rest of the data set. For the most part, the patterns were identical between the two groups. The proteins themselves are also composed of a similar number of amino acids and somewhat similar mass (Tau: 758 amino acids and 78,928 Da vs. APP: 770 amino acids and 86,943 Da).

The scatter plot to the right was generated by performing Principal Component Analysis on the Morgan Fingerprints of the training data. The 2,048-bit vectors were reduced to two-dimensions for easier visualization and evaluation. When evaluating the explicit properties of the active and inactive compounds, it doesn’t appear like any substantial differences exist as shown by the figure below.


Your Image


Methods


The project was developed using the Paperspace Cloud Platform to access GPU resources. The models were trained on the NVIDIA RTX 4000 Graphics Card.

The main framework used for development of the analyses was the DeepChem Python library [10]. DeepChem builds on top of PyTorch and Tensorflow deep learning models, making development easier for biological and chemical machine learning. DeepChem provides dozens of deep learning models and architectures that can be used for different classification and regression models.

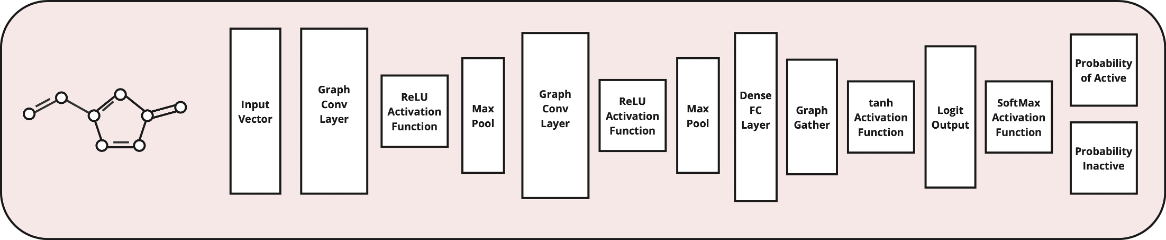
The GraphConvModel, built on top of a Keras Graph Convolution Neural Network Model, was the primary model used for this project. The GraphConvModel has a general architecture like that pictured below, composed of graph convolutional layers, max pooling, and ReLU activation functions. Prior to final probabilities, a dense layer is used to produce outputs based on the trained molecular embedding. The softmax activation function finally converts these outputs into the class probabilities.
RDKit, one of the most popular cheminformatics Python libraries, was used heavily throughout the project as well.

Molecular Graph Generation
Molecular graphs are generated using the ConvMolFeaturizer function. SMILES strings are passed into the function and a ConvMol object is returned. This object maintains the adjacency matrix and atom descriptor matrix for the molecule and can be passed directly into the GraphConvModel. The model subsequently extracts the numeric features of the ConvMol object for training and predictions.

Data Preparation
Prior to any training and predictions, compounds were stripped of salts and had their charges neutralized using RDKit. Subsequently, the PubChem Data was split into 80:10:10 (train: validation: test) sets. The RandomStratifiedSplitter DeepChem function was used to randomly split the assay data while maintaining equivalent active class percentages between the sets. The BalancingTransformer DeepChem function was used to balance the weights of the active and inactive classifications during training. This helps mitigate the consequences of highly class-imbalanced datasets, common in drug-discovery tasks, and very relevant to the data in this project.

Model Architectures
I built on the default parameters of the DeepChem GraphConvModel and expanded my testing from these default parameters. For both protein targets, I performed a random grid search of different model architectures and intermittently measured the precision and recall throughout training. The parameters tested included:

Each target was tested with more than 100 combinations of the parameters for 50-150 epochs. Early stopping was performed if the models did not predict any active classifications after the 10th epoch. Fixed parameters of the models included the use of the Adam optimizer, a learning rate = 0.001, a classification threshold = 0.2 (> 0.2 probability = active classification) and the binary cross-entropy loss function. The softmax activation function was used to calculate the probabilities of each compound being active or inactive against the target protein.


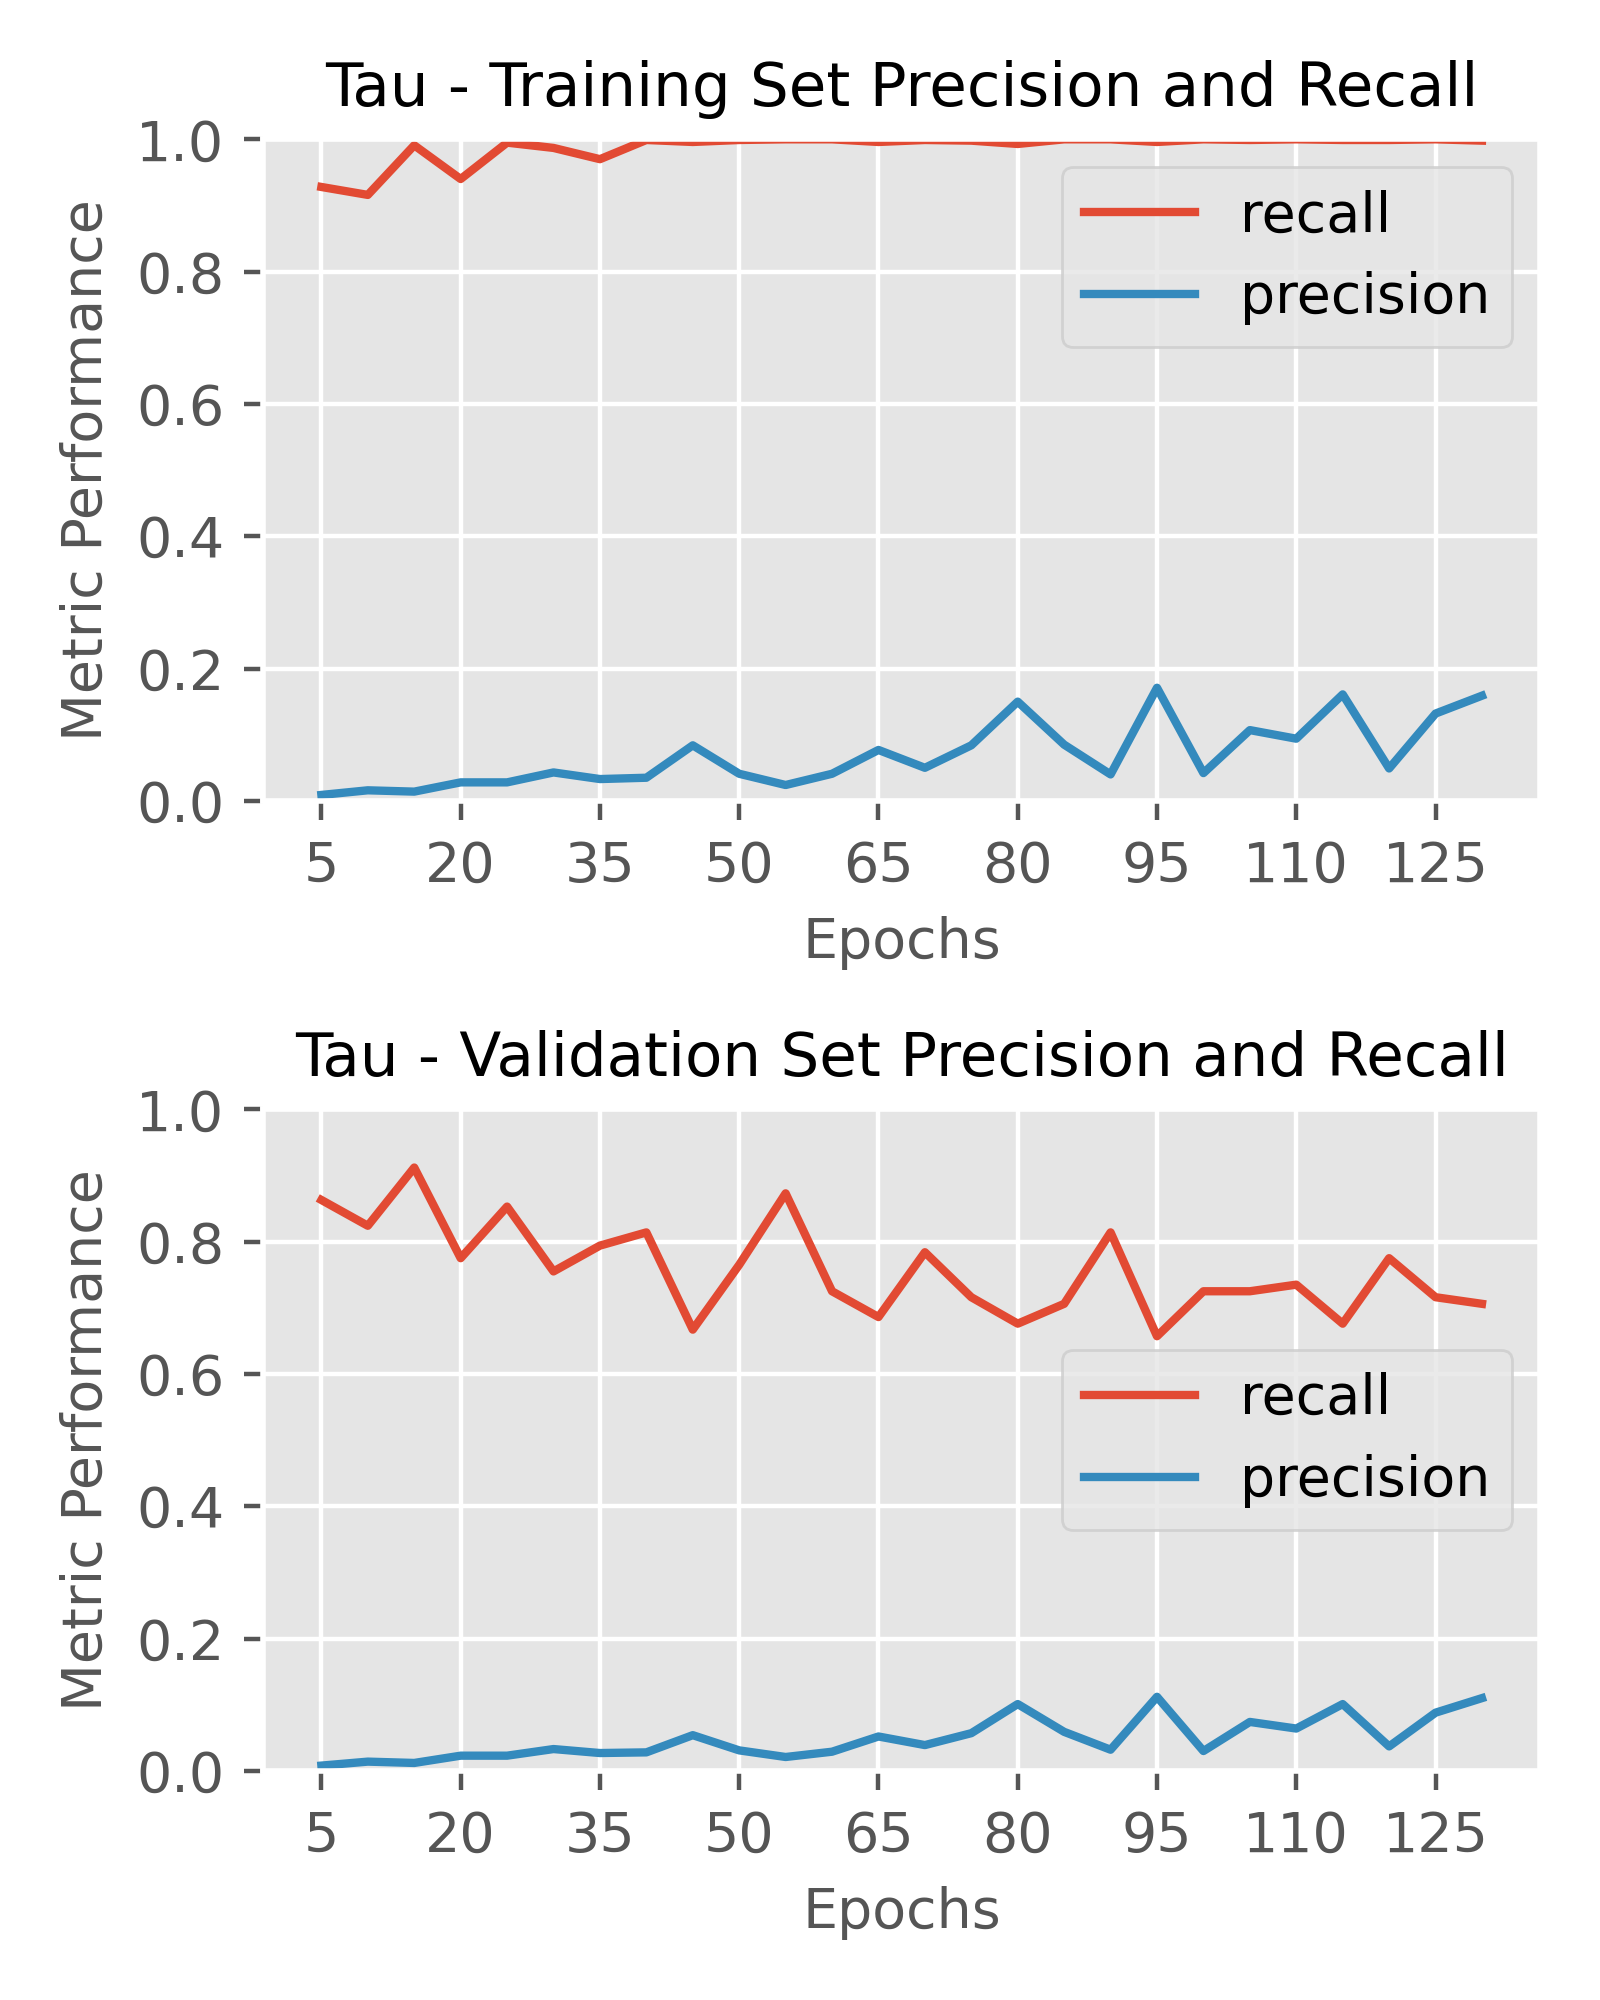
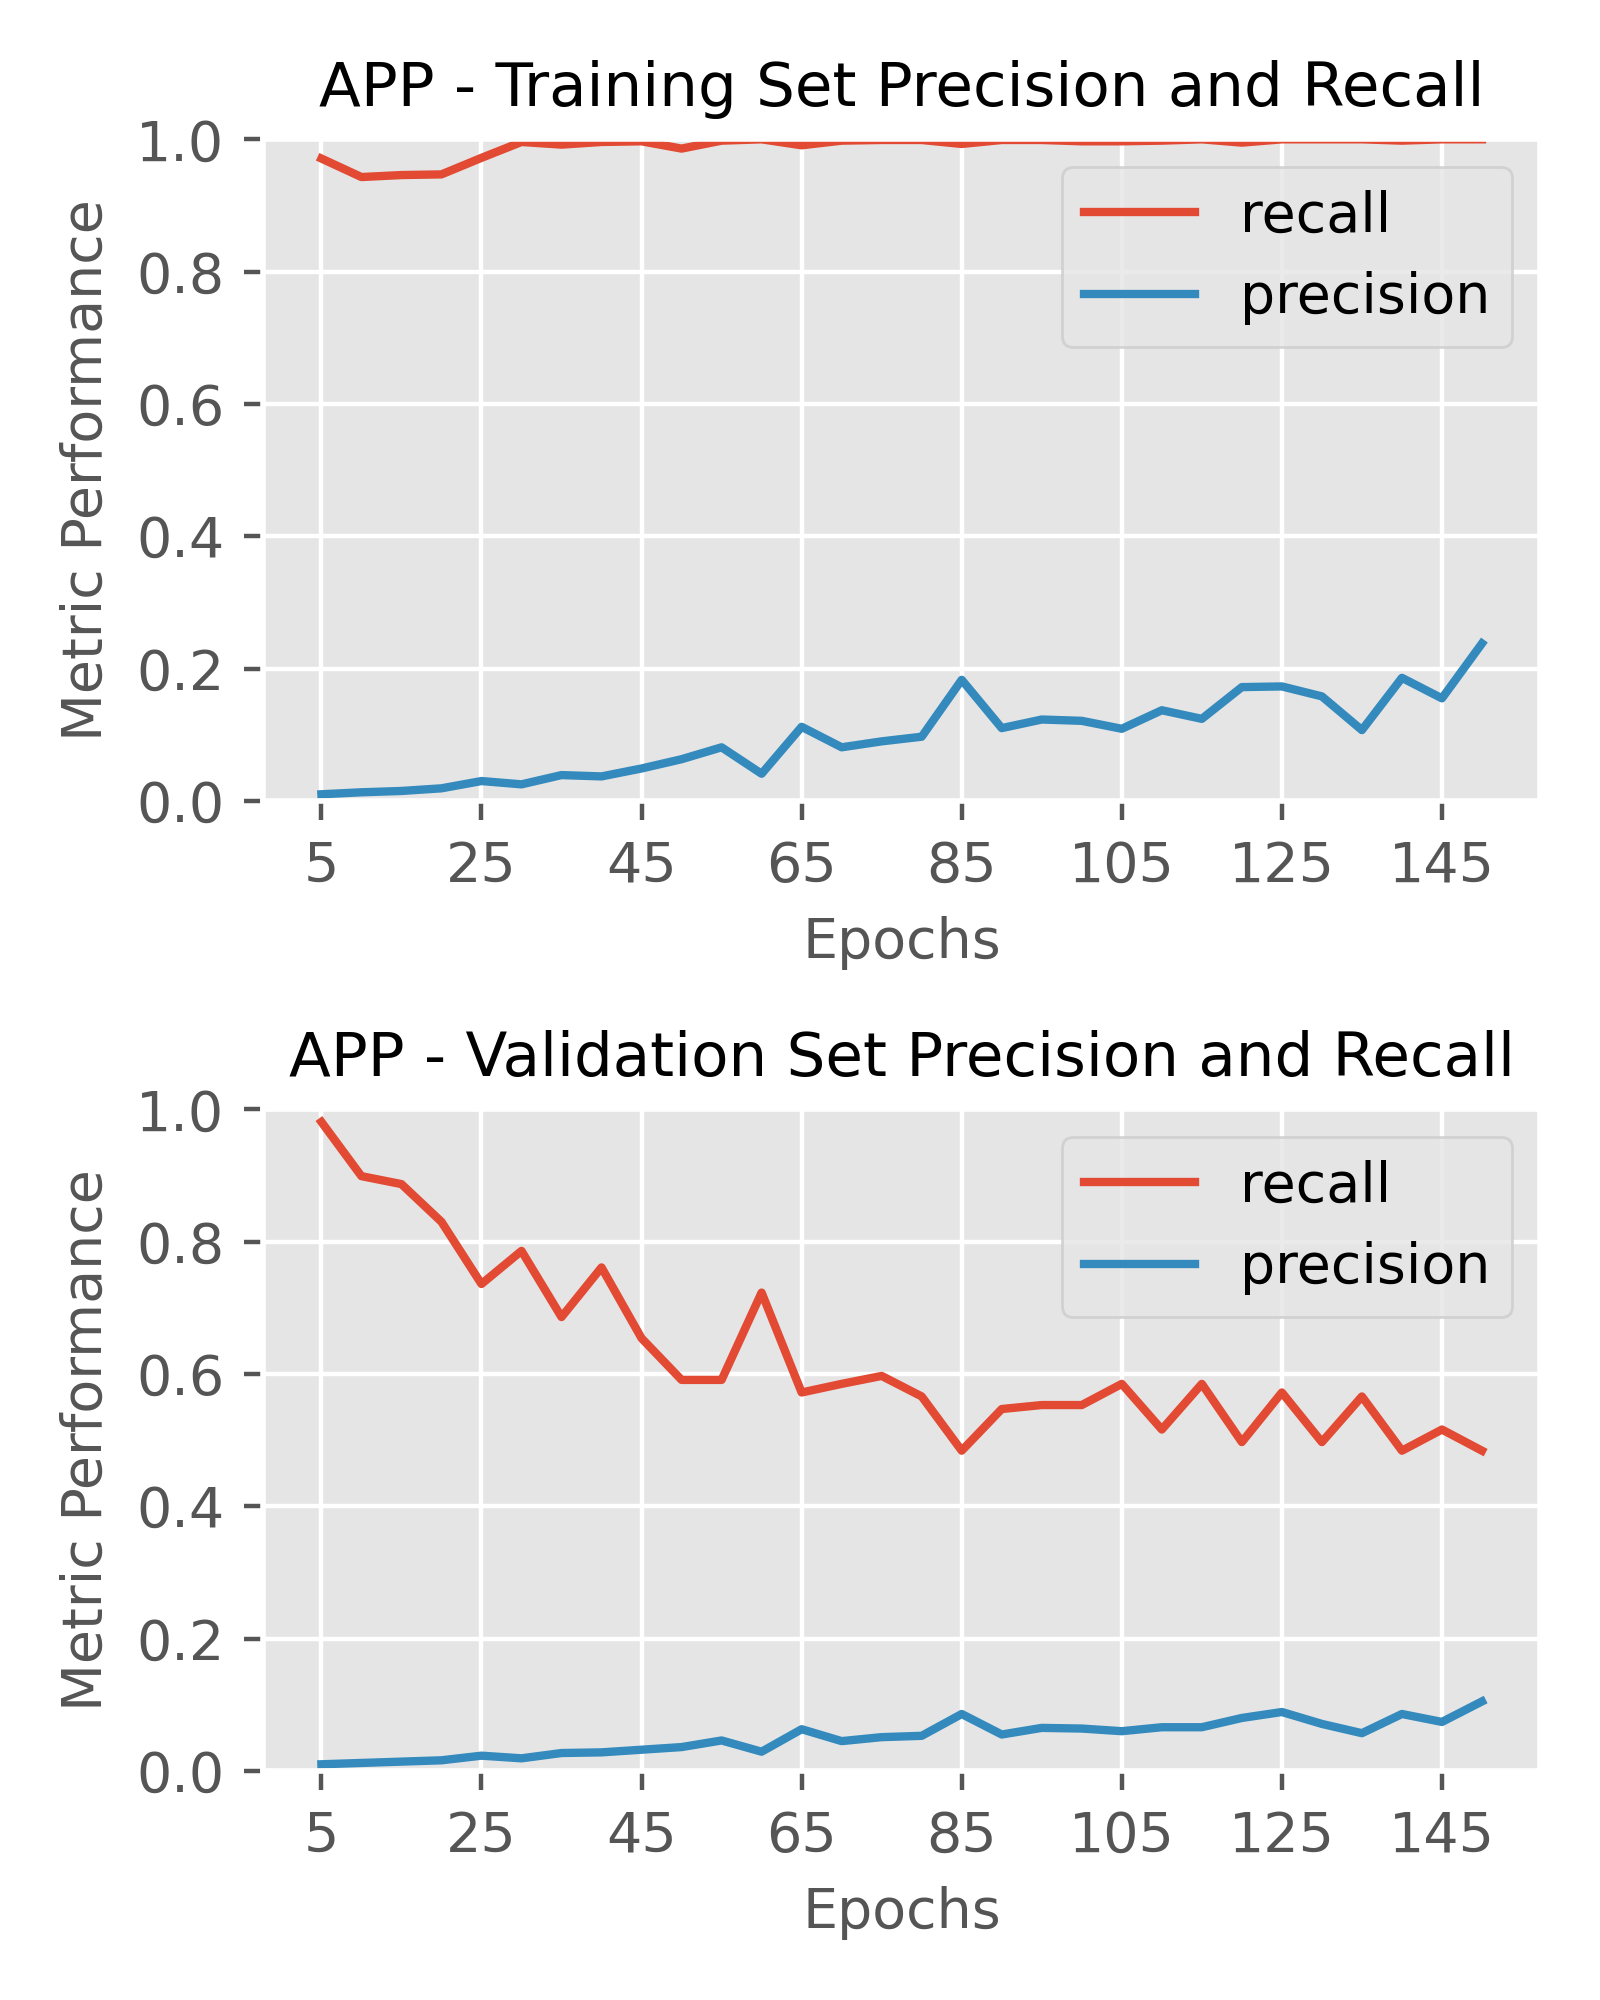
Final Model – Outputs and Performance


After extensive testing of various architectures, I chose the optimal architectures for the targets as follows. A prediction threshold of 0.2 was used for labeling compounds as active or inactive to calculate performance metrics. My primary metric of interest was precision, as I wanted to optimize hit rate and in-vitro screening efficiency, however recall was still important to ensure I wasn’t missing out on too many true positives either.

Tau Model Architecture

  • Batch Normalization = True
  • Dropout = 0
  • Size of the final fully-connected (dense) layer = 256
  • The size and number of graph convolution layers
    • [64, 128, 64]
  • Epochs = 150
APP Model Architecture
  • Batch Normalization = False
  • Dropout = 0
  • Size of the final fully-connected (dense) layer = 256
  • The size and number of graph convolution layers
    • [64, 64, 64, 64]
  • Epochs = 130
The following parameters were fixed for each of the models: Adam optimizer, softmax activation function, and binary cross-entropy loss function was used. The learning rate was set to 0.001.

For both models, you can see that there is a decent amount of overfitting. The training data display near perfect recall as the models are very likely to predict compounds as active. Over the course of training however, the precision does improve with both the training and validation sets. I chose the final number of epochs based on the ideal balance between precision and recall, as validation recall was dropping over time. Although I would prefer to better optimize and limit this overfitting, most model architectures exhibited at least some overfitting and is hard to avoid with such class imbalanced data. With that being said, I still consider the validation data performance to be acceptable for this project and task.


Your Image
Your Image


Prediction Set
With the final architectures, the DrugBank data set was passed into the models. In total, 9,468 compounds are in the DrugBank dataset, although about 10% of these compounds are also included in the training data. After removing the DrugBank compounds in the training set, there were 8,334 remaining compounds.

Using the same 0.2 probability threshold for activity as done in training, 494 compounds (85 approved) were predicted active for APP and 505 compounds (68 approved) for Tau.


Crossing the Blood Brain Barrier


It’s important to understand that the nominations provided by our models are predicted to inhibit levels of each target in-vitro. There is no consideration until this point about future use in humans or even animals. To bring this into consideration, I need to think about different ADMET (absorption, distribution, metabolism, and excretion–toxicity) properties that influence availability (absorption) within the brain.

To aid in determining the optimal characteristics and thresholds for CNS targeting drugs, I’ve found a set of CNS interacting drugs [11] to use as positive controls. I subsequently compared my DrugBank nominations to these drugs to filter out compounds that were less likely to cross the blood brain barrier. For filtering, I developed a set of rule-based flags for explicit molecular features that make a molecule less likely to cross the BBB. In addition, I’ve used an existing predictive model that predicts whether a compound can cross the blood brain barrier.

Rule-Based Indications
There are many molecular properties that impact a compound’s ability to cross the blood brain barrier, but there is a general consensus that a compound’s size, polarity, and lipophilicity are important factors. Based on the known literature, the nine properties below are associated with a compound’s likelihood of crossing the blood brain barrier. I’ve loosely developed the flagging criteria based on existing literature [12-14].

  1. Molecular Weight (MW): < 600 Daltons
    • Molecules with too large of a molecular weight are unable to passively diffuse through the lipid membranes. Although possible to pass through the BBB, these molecules typically require active transport or permeation through other means.
  2. Polar Surface Area (PSA): < 80 Å2
    • PSA is area of the molecule that displays a positive or negative charge. The presence of charges lowers the hydrophobic property of the molecule making it more difficult to diffuse through the membrane.
  3. Number of Rotatable Bonds: < 5
    • The number of rotatable bonds measure how rigid or flexible the molecule is in space. If the molecule is too flexible, it will have a hard time diffusing through the cell membrane [15].
  4. Hydrogen Bond Donors (HBD): < 7
    • Hydrogen bond donors can impact the polarity of a molecule and its interactions with polar molecules. This polarity should be minimized to passively diffuse through both the exterior and interior sections of cell membranes.
  5. Hydrogen Bond Acceptors (HBA): < 7
    • Hydrogen bond acceptors can also impact the polarity of a molecule and its interactions with polar molecules. Therefore, the HBA counts should be minimized as well to maximize the likelihood of passing through the membrane.
  6. pKa Acidic: > 6
    • The pKa is a measure of an acid’s strength. This metric represents the pKa of the most acidic functional group on the molecule. The most acidic group is relative to the other functional groups on the molecule, but a common example is a hydroxyl (OH) group.
  7. pKa Basic: >7 and < 11
    • This measure represents pKa of the most basic functional group on the molecule. A common example is an amine (NH) group or fluorine (F), but again depends on the other functional groups on the molecule.
  8. LogP: > 1.5 and < 5
    • The LogP of a compound is associated with how lipophilic or hydrophilic the compound is. This measure is indicative of a compound's ability to travel through the body via the bloodstream and to cross the cell membrane.
  9. LogD: > 0 and < 4
    • LogD is a comparable to LogP, however LogD considers the ionization state of the compounds at different pH. For example, the ionization state of a compound will be different in the acidic environment of the stomach, and therefore its lipophilic properties will be altered.
The CNS drugs show an obvious skew towards less flags, suggesting the flags I’ve developed are appropriately related to a compound’s ability to cross the BBB. Based on the distribution of flags for our control set, I chose to use a threshold of 3 flags as the limit of acceptable flags for pushing through a nomination


Predicted ADMET Indication
ADMET (Absorption, Distribution, Metabolism, Excretion, and Toxicity) properties are of high interest for potential drugs. These properties are largely indicative of the efficacy, safety, and potential limitations in clinical settings. Therefore, a large emphasis has been placed on accurately predicting ADMET properties prior to investing considerable time and money in drug development.

One measure of ADMET is the ability of a compound to cross the blood brain barrier. Many models have been developed to predict a compound’s ability to passively diffuse through the endothelial cell membranes of the BBB. For this analysis I used available ADMET predictions from ADMETlab 2.0 [16] accessed through the web-interface.

The distribution of flags and ADMET properties for the nominated compounds, as well as the positive control drugs are represented below. I found it surprising that such a large proportion of Tau nominations had very low permeability predictions from this model. The APP nominations had a more U-shaped probability distribution which I found interesting as well. As expected, the known CNS acting drugs display considerably higher BBB permeability predictions than the nominated compounds. Based on the distribution of these positive controls, I chose to use a score of 0.8 as the threshold of pushing through as a nomination.


There are dozens of ADMET properties that are predicted to assess a compound’s potential safety and bioavailability, however, the benefit of using previously used drugs in DrugBank is that these compounds have largely proven bioactivity and safety in clinical populations. Thus, I did not feel the need to evaluate other ADMET properties in this project.

Final Nominations


After filtering compounds for predicted blood brain permeability (< 4 flags and > 0.8 ADMET score), I was left with roughly 100 nominations (30 approved) between the two targets. After doing a brief dive into some of the top nominations, considering rank of probability of a hit, and then a brief investigation into the known properties, safety, and current use of each drug; I’ve prioritized the following 8 compounds as my lead drugs of interest.

Final Tau Nominations

Nomination Apomorphine Lasofoxifene (S)-wiskostatin CHEMBL87277
DrugBank Status Approved,
Investigational
Approved Experimental Experimental
Active Probability 0.999 0.543 0.995 0.999
Rule-Based Flags 0 3 0 2
BBB ADMET Prediction 0.987 0.885 0.996 0.956

  1. Apomorphine (DrugBank DB00714; PubChem CID 6005) was approved by the FDA in 2004 for treatment of Parkinson’s Disease, although primarily to treat motor symptoms. Developed by Britannia Pharmaceuticals under the name Apokyn, the derivative of Morphine is administered orally or through subcutaneous injection. Although Tau fibrils are not a major factor in Parkinson’s Disease etiology, there are studies suggesting the fibrils are involved with PD [19]. I’d be curious to see if there is any data on cognitive decline or evaluate levels of Tau fibrils in PD patients in conjunction with their prescribed drugs

  2. Lasofoxifene (DrugBank DB06202; PubChem CID 216416) was approved by the European Medicines Agency in 2009. Currently marketed as Fablyn in Lithuania and Portugal, it was developed by Pfizer to treat osteoporosis in post-menopausal women. It’s a known nonsteroidal selective estrogen receptor modulator (SERM) [17]. Currently it is being investigated in the treatment of breast-cancer and is undergoing clinical trials in the United States. This compound does not make my final nomination list because of its predicted properties, but I am particularly interested in this drug due to its clinical history. This drug was developed for long-term use, and for the last 15 years it has been prescribed in Europe. As the target population is older women, I’d be very interested to see any longitudinal studies on cognitive decline or rates of AD in women that have been prescribed Lasofoxifene.

  3. (S)-wiskostatin (DrugBank DB01731; PubChem CID 448668) is an experimental drug that does not appear to be in clinical trials as of 2023. The current focus is on the interaction with the Wiskott-Aldrich syndrome protein (WASp; UniProt P42768) [18], a protein implicated in a rare immune disorder. I couldn’t find much else done with (S)-wiskostatin, however, due to its predicted activity and potential BBB permeability I am including this as a final nomination.

  4. CHEMBL87277 (1-(5-Tert-butyl-2-methyl-2H-pyrazol-3-YL)-3-(4-chloro-phenyl)-urea) (DrugBank DB02277; PubChem CID 446816) is an experimental drug that does not have very much public information. There are only 12 linked publications within PubChem, zero of which involve work past the in-vitro testing stage. The drug is a known MAPK inhibitor and has been tested in 662 PubChem bioassays. Most of these assays target proteins in the MAPK protein family, highlighting its interest in MAPK associated disorders. I am primarily interested in CHEMBL87277 due its high probability of activity.
Final APP Nominations

Nomination Flunisolide Molindone Quinupramine Fluprednisolone
DrugBank Status Approved Approved Approved Approved
Active Probability 0.984 0.955 0.944 0.905
Rule-Based Flags 1 1 1 2
BBB ADMET Prediction 0.950 0.977 0.996 0.880

  1. Flunisolide (DrugBank DB00180; PubChem CID 82153) is an anti-inflammatory corticosteroid prescribed to treat asthma and allergies through inhalation or intranasal administration. It has been approved in the United States since 1981 by the FDA. This drug has both high predicted activity and BBB permeability, making it an interesting candidate. Another reason of interest, however, is the known history and approval of intranasal administration. Administering intranasally considerably increases the likelihood of the compound reaching the central nervous system, as this route of administration bypasses the blood brain barrier [20].

  2. Molindone (DrugBank DB01618; PubChem CID 23897) was approved by the FDA in 1974 as an oral tablet. The drug is primarily used for treatment of schizophrenia and has been used for the treatment of conduct disorders as well. I am again curious if there are any follow up studies on patients who have taken this drug. It belongs to the class of “first-generation” antipsychotics, which have largely been replaced with newer atypical antipsychotics with fewer side-effects. Although it is not prescribed as frequently as in the past, with 50 years of clinical approval there is likely a large sample of patients who have had both short-term and long-term exposure to study.

  3. Quinupramine (DrugBank DB13246; PubChem CID 93154) is a tricyclic antidepressant that has been approved and used in France through oral administration since the 1980s. Aside from basic information about the drug and its history, there is not much background or details of the drug I could find. Interestingly, the drug has only been tested in four PubChem bioassays with only 39 linked publications. Although the drug has been used in clinical populations for decades, there does not appear to be much followed up interest in the drug.

  4. Fluprednisolone (DrugBank DB09378; PubChem CID id 5876) was developed by Pharmacia & Upjohn and has been available since the early 1960s [21], although It became FDA approved in 1982. A known anti-inflammatory corticosteroid that has been prescribed orally to treat allergies, arthritis, and other ailments. This was one of the higher ranked drugs, and with its clinical history, I thought would be interesting to investigate.

Conclusion


Although reducing levels of amyloid plaques and Tau fibrils in the brain of AD patients is desirable, the complex etiology of the disease does not necessarily guarantee prevention of AD or slowing of disease progression. Some of my nominations are not based on if I think they would be the most likely in-vitro hit, but on the potential to use existing data to evaluate clinical populations that have been treated with the drug. For both Tau and APP, there are methods to detect the levels of these proteins through imaging and analysis of cerebrospinal fluid. Recently, a simpler and less expensive blood test was also developed to indicate levels of APP in the brain [22]. By testing these populations, we could quickly assess whether the drug has had any impact on levels of APP or Tau in the brain, rates of Alzheimer’s Disease, and rates of progression on AD symptomology.

My initial plan for this project was to focus on the deep learning aspect of drug discovery. My hope was to perform multi-task modeling to test on both Tau and APP within a single model. However, because of such significant class imbalance, it proved very difficult, and I therefore focused on single-task modeling.

The more I worked on this project the further into the full drug discovery pipeline I became involved with. In subsequent projects I’d like to return to more of a focus on the deep learning aspect of the drug discovery pipeline. I’d like to spend more time fine-tuning and tweaking the parameters of the convolutional neural network. Typically, dropout and batch normalization are useful parameters in deep learning frameworks, and I didn’t dive into tuning them at a layer specific level, instead choosing to globally define each feature across all layers. I’d also like to dip into other graph models provided by DeepChem Notably, the GraphConvModel does not incorporate bond types into the graph metadata, which I’d prefer to account for as the bond types can significantly impact interactions with proteins as well as stereochemical properties of molecules.

The class-imbalance is something I don’t believe I addressed well enough as well. Balancing the weights of class-imbalanced datasets is one useful technique, however with such considerable imbalance, in future projects I’d like to dive more into up-sampling, down-sampling, and other techniques to avoid the consequence of imbalanced data.

Although this was just building on a school project, my final nominations have piqued my interest in these drugs as potential treatments in AD. With the evolving techniques and strategies used in drug discovery, I hope that we can continue to build on our understanding of neuroscience to develop better treatments for neurodegenerative and psychiatric disorders.


References


1. Stokes, J.M., et al., A Deep Learning Approach to Antibiotic Discovery. Cell, 2020. 180(4): p. 688-702.e13.

2. Gonzalez, A., et al., Alzheimer's Disease and Tau Self-Assembly: In the Search of the Missing Link. Int J Mol Sci, 2022. 23(8).

3. O'Brien, R.J. and P.C. Wong, Amyloid precursor protein processing and Alzheimer's disease. Annu Rev Neurosci, 2011. 34: p. 185-204.

4. Wishart, D.S., et al., DrugBank 5.0: a major update to the DrugBank database for 2018. Nucleic Acids Res, 2018. 46(D1): p. D1074-d1082.

5. Wang, Y., et al., Retro Drug Design: From Target Properties to Molecular Structures. bioRxiv, 2021.

6. Wong, A., et al., The Blood-Brain Barrier: An Engineering Perspective. Frontiers in neuroengineering, 2013. 6: p. 7.

7. Pardridge, W.M., Biopharmaceutical drug targeting to the brain. J Drug Target, 2010. 18(3): p. 157-67.

8. PubChem, PubChem Bioassay Record for AID 1285, Primary screen for compounds that inhibit Alzheimer's amyloid precursor protein (APP) translation, C.U.M.S. Center, Editor. 2023, PubChem: National Center for Biotechnology Information.

9. PubChem, PubChem Bioassay Record for AID 1468, qHTS for Inhibitors of Tau Fibril Formation, Fluorescence Polarization, N.C.f.A.T.S. (NCATS), Editor. 2023, National Center for Biotechnology Information: PubChem.

10. Ramsunder, B., Eastman, P., Walters, P., Pande, V., Leswing, K., & Wu, Z., Deep Learning for the Life Sciences. 2019: O'Reilly Media.

11. ericminikel, List of FDA-approved drugs and CNS drugs with SMILES, in CureFFI.org. 2013.

12. Ghose, A.K., et al., Knowledge-Based, Central Nervous System (CNS) Lead Selection and Lead Optimization for CNS Drug Discovery. ACS Chem Neurosci, 2012. 3(1): p. 50-68.

13. Kadry, H., B. Noorani, and L. Cucullo, A blood-brain barrier overview on structure, function, impairment, and biomarkers of integrity. Fluids Barriers CNS, 2020. 17(1): p. 69.

14. Wu, D., et al., The blood-brain barrier: structure, regulation, and drug delivery. Signal Transduct Target Ther, 2023. 8(1): p. 217.

15. Veber, D.F., et al., Molecular properties that influence the oral bioavailability of drug candidates. J Med Chem, 2002. 45(12): p. 2615-23.

16. Xiong, G., et al., ADMETlab 2.0: an integrated online platform for accurate and comprehensive predictions of ADMET properties. Nucleic Acids Research, 2021. 49(W1): p. W5-W14.

17. Ursu, O., et al., DrugCentral: online drug compendium. Nucleic Acids Research, 2016. 45(D1): p. D932-D939.

18. UniProt: the Universal Protein Knowledgebase in 2023. Nucleic Acids Res, 2023. 51(D1): p. D523-d531.

19. Pan, L., et al., Tau in the Pathophysiology of Parkinson's Disease. J Mol Neurosci, 2021. 71(11): p. 2179-2191.

20. Hanson, L.R. and W.H. Frey, 2nd, Intranasal delivery bypasses the blood-brain barrier to target therapeutic agents to the central nervous system and treat neurodegenerative disease. BMC Neurosci, 2008. 9 Suppl 3(Suppl 3): p. S5.

21. Timely Drugs. American Journal of Hospital Pharmacy, 1961. 18(11): p. 667-667.

22. Li, Y., et al., Validation of Plasma Amyloid-β 42/40 for Detecting Alzheimer Disease Amyloid Plaques. Neurology, 2022. 98(7): p. e688-e699.

© All rights reserved. Powered by Hugo and sustain with ♥